
Contents
- 0.1 呼吸の概要と学習目標
- 0.2 肺換気の力学的メカニズム
- 0.3 呼吸の力学と呼吸システムの圧力
- 0.4 呼吸筋(Muscles of Respiration)
- 0.5 吸気(Inspiration)
- 0.6 呼気(Expiration)
- 0.7 呼吸中の重要な圧力変化
- 0.8 解剖学的デッドスペース(Anatomical Dead Space)
- 0.9 肺胞デッドスペース(Alveolar Dead Space)
- 0.10 生理的デッドスペース(Physiological Dead Space)
- 0.11 呼吸の仕事(Work of Breathing)
- 0.12 肺の容積と容量(Lung Volumes and Capacities)
- 0.13 肺の容積と容量の種類
- 0.14 静的肺容積および容量
- 0.15 閉塞容積と解剖学的デッドスペースの測定方法
- 0.16 ヘリウム希釈法(Helium Dilution Method)
- 0.17 ボディプレチスモグラフ(Body Plethysmograph)
- 0.18 動的肺容積および容量(Dynamic Lung Volumes and Capacities)
- 0.19 弾性反動(Elastic Recoil)とコンプライアンス(Compliance)
- 0.20 コンプライアンス(Compliance):
- 0.21 コンプライアンスの種類
- 0.22 静的コンプライアンスが影響を受ける状態
- 0.23 動的コンプライアンス(Dynamic Compliance)
- 0.24 肺胞の表面張力(Alveolar Surface Tension)
- 0.25 サーファクタント(Surfactant)による表面張力の低下
- 0.26 サーファクタントの機能
- 0.27 サーファクタントの働きと表面張力
- 0.28 発生と変化
- 0.29 制限性疾患(Restrictive Disease)
- 0.30 閉塞性疾患(Obstructive Disease)
- 0.31 閉塞性疾患と制限性疾患の違い
- 0.32 流量-容量曲線(Flow-Volume Curve)
- 0.33 閉塞性疾患 (Obstructive Disease)
- 0.34 拘束性疾患 (Restrictive Disease)
- 0.35 まとめ
- 1 PULMONARY CIRCULATION, PULMONARY EDEMA, PLEURAL FLUID
- 2 肺毛細血管の動態 (Pulmonary Capillary Dynamics):
- 3 Pulmonary Ventilation
- 4 Pulmonary Circulation, Pulmonary Edema, and Pleural Fluid
呼吸の概要と学習目標
このモジュールの終わりまでに、学生は以下の内容を理解し説明できるようになることを目指します。
- 呼吸に関与する筋肉の特定
- 通常の安静呼吸(normal quiet breathing)で使用される筋肉
- 努力呼吸(heavy breathing)で使用される筋肉
- 呼吸サイクルにおける圧力と体積の変化の図示
- 胸膜圧(pleural pressure)
- 肺胞圧(alveolar pressure)
- 気流(airflow)
- 肺容量(lung volume)
- 大気圧と肺胞圧の差が呼吸を引き起こす仕組みの説明
- 肺コンプライアンス(compliance)の定義と臨床的な意義
- 肺コンプライアンスが高い、または低い代表的な疾患の特定
- 機能的残気量(functional residual capacity)における陰性胸膜内圧(negative intrapleural pressure)を生み出す力の特定
- スパイログラム(spirogram)の作図と肺容量・肺活量のラベル付け
- 4つの肺容量(lung volumes)
- 4つの肺活量(lung capacities)
- スパイロメトリー(spirometry)で測定できない容量や活量の特定
- 表面張力(surface tension)の定義と肺の力学への影響
- 肺胞サイズとサーファクタント(surfactants)の役割
- 無気肺(atelectasis)の定義とサーファクタントの役割
- 肺サーファクタントの主要な成分とその役割の説明
- 気道径(airway diameter)と乱流(turbulent flow)が気道抵抗(airway resistance)に与える影響の説明
- 全身循環と肺循環の圧力、血流抵抗、低酸素状態への反応の違いの説明
- 立位の人における肺血流(pulmonary blood flow)の地域差の説明
- 肺のゾーンI、II、IIIの定義と肺血管圧(pulmonary vascular pressure)と肺胞圧(alveolar pressure)に基づく説明
- 解剖学的死腔(anatomic dead space)、生理的死腔(physiologic dead space)、無駄な換気(wasted ventilation)、総換気量(total minute ventilation)、および肺胞換気量(alveolar minute ventilation)の定義と対比
- 心拍出量(cardiac output)や肺動脈圧(pulmonary arterial pressure)の変化による肺血管抵抗(pulmonary vascular resistance)の変化の説明
- 肺容量の変化による肺血管抵抗の変化の説明
- 低酸素性肺血管収縮(hypoxic pulmonary vasoconstriction)が肺血流の分布に与える影響の説明
- 肺水腫(pulmonary edema)の発生メカニズムの説明
- 増加した水圧(increased hydrostatic pressure)
- 透過性の増加(increased permeability)
- リンパ流出の障害や中心静脈圧(central venous pressure)の上昇
- 気管支循環(bronchial circulation)の主要な機能の説明
- 最大努力呼気(maximal expiratory effort)によるスパイログラムの作図とラベル付け
- 努力肺活量(forced vital capacity: FVC)
- 強制呼気量(timed forced expiratory volumes: FEVs)
- 最大呼気流量(maximal expiratory flow)
- 拘束性肺疾患(restrictive lung disease)と閉塞性肺疾患(obstructive lung disease)の二大分類の対比とスパイロメトリー異常
肺換気の力学的メカニズム
機能解剖学
- 肺の肺胞(alveoli)の総数: 約3億〜5億個
- 肺胞の総表面積: 50〜100平方メートル(平均70平方メートル)
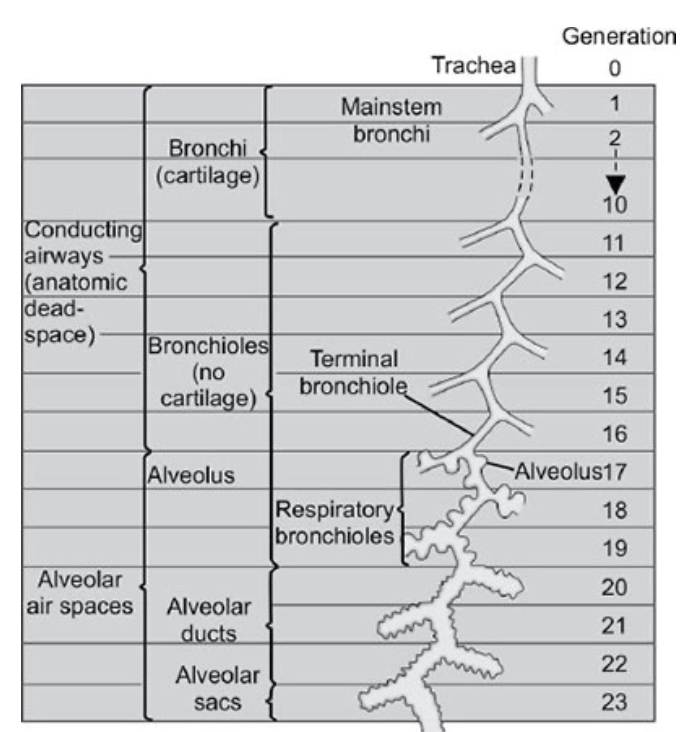
ワイベルの分類(Weibel’s classification)
- 気道の分岐:
気管(trachea)から肺胞嚢(alveolar sacs)まで、気道は23回分岐します。気管は第0世代(generation 0)とされます。 - 気道の機能的ゾーン:
気道は2つの機能ゾーンに分けられます。- 伝導ゾーン(conducting zone)
- 最初の16世代までが伝導ゾーンに含まれます。
- 鼻や口から始まり、気管支(bronchi: 第10世代)、終末細気管支(terminal bronchioles: 第11〜16世代)までが含まれます。
- 呼吸ゾーン(respiratory zone)
- 残りの7世代が呼吸ゾーンです。
- 呼吸細気管支(respiratory bronchioles: 第17〜19世代)、肺胞管(alveolar ducts: 第20〜22世代)、肺胞嚢(alveolar sacs: 第23世代)が含まれます。
- 伝導ゾーン(conducting zone)
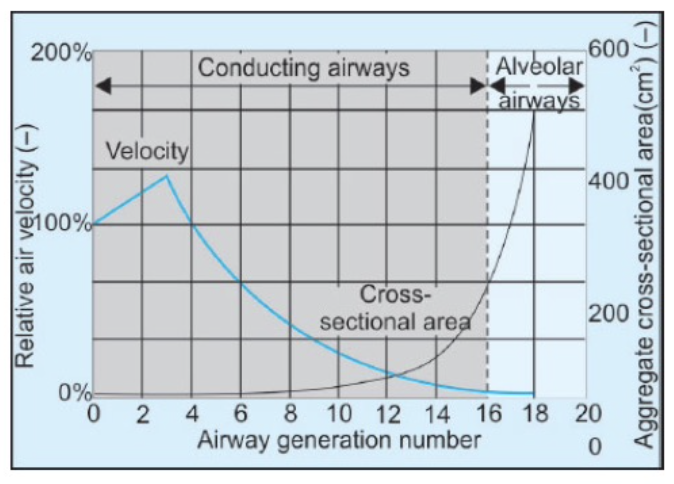
気管から肺胞へ移動するにつれて
- 気道の直径は小さくなります。
- 乱流(turbulence)の発生確率が低下します。
- 気道抵抗(airway resistance)が最大となる場所:
中程度の大きさの気管支(直径2〜4 mm、気管支分岐の第5世代付近)が主な気道抵抗の部位です。- 最大の気流乱流は気管で発生します。
気管支収縮と拡張
- 気管支収縮(Bronchoconstriction):
- 刺激物(irritants)による反射的収縮(これはコリン作動性に媒介されます)
- 冷たい空気、運動、呼気(expiration)、ロイコトリエン(leukotrienes)、サブスタンスP(substance P)、コリン作動性刺激、早朝(約午前6時)などが原因となります。
- 気管支拡張(Bronchodilation):
- アドレナリン作動性刺激(adrenergic stimulation)
- 非アドレナリン非コリン作動性神経(NANC)刺激(この場合、神経伝達物質はVIP)
- 吸気(inspiration)
- 夕方(約午後6時)などが原因となります。
呼吸の力学と呼吸システムの圧力
胸膜内圧(Pleural pressure, Ppl)
- 胸膜内圧(Ppl): 胸膜腔(pleural space)内の圧力のことです。
- 胸膜腔: 小量(10〜20 mL)の液体が含まれています。
- 肺の安静状態: 肺の弾性組織と臓側胸膜(visceral pleura)が弾性復元力で胸壁と壁側胸膜(parietal pleura)に反する方向に引っ張られるため、胸膜腔内の圧力が負(大気圧以下)になります。これが陰圧(negative pressure)です。
- 胸腔内圧(intrapleural pressure): 吸気の開始時には約-2.5 mmHg(大気圧に対して)であり、吸気や呼気に伴い変動します。
肺胞内圧(Alveolar pressure, PA)
- 肺胞内圧(PA): 肺胞(alveoli)内の圧力のことです。
経肺圧(Transpulmonary pressure, PL)
- 経肺圧(PL): 肺胞内圧(PA)と胸膜内圧(Ppl)の圧力差のことです。
呼吸筋(Muscles of Respiration)
安静呼吸(Quiet respiration)中の呼吸筋
- 吸気(Inspiration): 主な呼吸筋は横隔膜(diaphragm)で、全体の75%を占めます。残りの25%は外肋間筋(external intercostal muscle)です。
- 呼気(Expiration): 呼気筋は使われず、パッシブ(受動的)に行われます。
努力呼吸(Forceful respiration)中の呼吸筋
- 吸気: 斜角筋(scalene)、胸鎖乳突筋(sternocleidomastoid)などが使用されます。
- 呼気: 内肋間筋(internal intercostal muscles)、前腹筋群(anterior abdominal muscles)などが関与します。
吸気(Inspiration)
吸気は能動的なプロセスです。通常の吸気に関連する一連のイベントは以下の通りです。
- 脳が吸気努力を開始します。
- 神経が吸気命令を吸気筋に伝えます。
- 横隔膜(diaphragm)および/または外肋間筋(external intercostal muscles)が収縮します。
- 胸壁が拡張し、胸腔の容積が増加します。
- 胸膜内圧(Ppl)はより負になります(通常、吸気の開始時には-2.5 mmHgで、約-6 mmHgに減少します)。
- 経肺圧勾配(transpulmonary pressure gradient)が増加します。
- 肺胞が拡張し、それに伴い肺胞弾性復元力が増加します。
- 肺胞容積が増加することで肺胞内圧(PA)が大気圧より低下し、気流のための圧力勾配が確立されます(吸気のピーク時には-1 mmHg)。
- 肺胞内圧が大気圧と均衡するまで、空気が肺胞内に流れ込みます。
※経肺圧勾配(Pulmonary Pressure Gradient)とは、肺内での異なる部分間の圧力差を指します。特に、肺動脈と肺静脈または肺胞内の圧力との差を示します。この圧力勾配は、肺の血流とガス交換の効率に重要な役割を果たします。
呼気(Expiration)
呼気はパッシブなプロセスです。通常の呼気に関連する一連のイベントは以下の通りです。
- 脳が吸気命令を停止します。
- 吸気筋が弛緩します。
- 胸腔の容積が減少し、それに伴い胸膜内圧(Ppl)が減少し、経肺圧勾配が低下します。
- 経肺圧勾配の低下により、増加した肺胞弾性復元力が肺胞を吸気前の容積に戻します。
- 肺胞容積の減少により、肺胞内圧(PA)が大気圧より高くなり、気流のための圧力勾配が確立されます。
- 肺胞内圧が大気圧と均衡するまで、空気が肺胞から排出されます。
呼吸中の重要な圧力変化
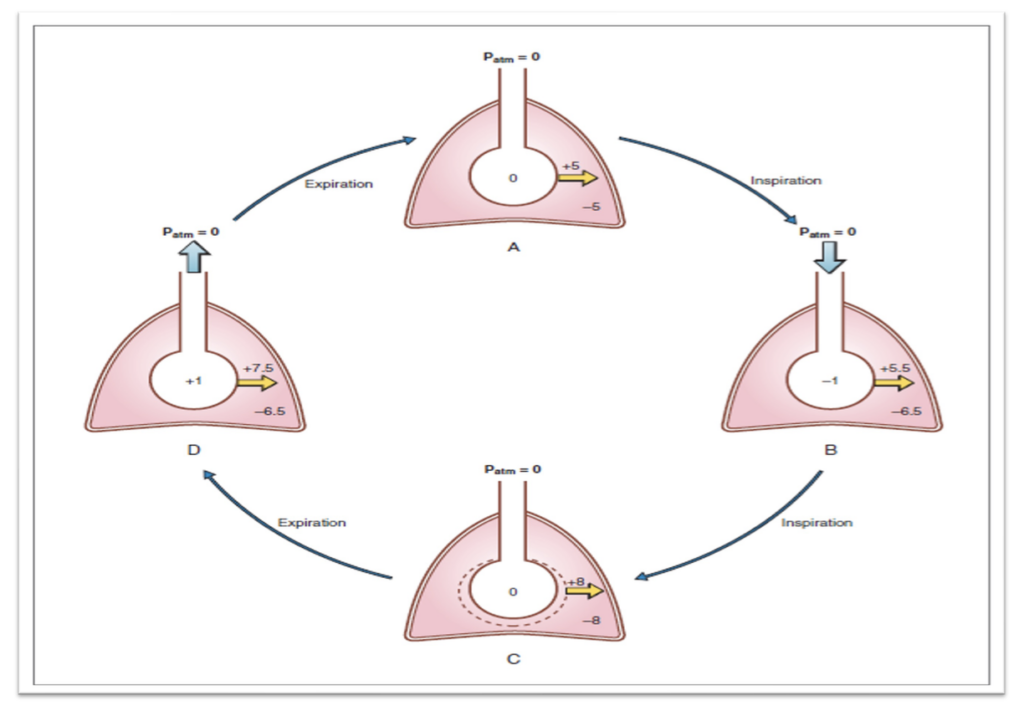
胸膜内圧(Pleural Pressure)
- 安静吸気の開始時: 胸膜内圧は-2.5 mmHgまたは-5 cmH2Oです。これは大気圧(760 mmHg)より2.5 mmHg低い圧力を意味します。
- 吸気の終わり: 胸膜内圧は-6.0 mmHgまで低下します。
- 呼気の終わり: 胸膜内圧は再び-2.5 mmHgに戻ります。
肺胞内圧(Alveolar Pressure)
- 吸気のピーク時: 肺胞内圧は-1 mmHgです。
- 呼気のピーク時: 肺胞内圧は+1 mmHgになります。
- 吸気と呼気の開始時および終了時: 肺胞内圧はゼロ、つまり大気圧と同じです。
強い呼吸努力による圧力変化
- 強い吸気努力: 胸膜内圧は-80 mmHgまで低下することがあります(ムラー法: Muller’s maneuver)。
- 強い呼気努力: バルサルバ法(Valsalva maneuver)などでは、胸膜内圧が100 mmHg以上に増加することがあります。
解剖学的デッドスペース(Anatomical Dead Space)
- 解剖学的デッドスペースの定義:
口、鼻から終末細気管支(terminal bronchioles)までの伝導気道(conducting zone)内のガスの容積を指します。
平均容積: 約2 mL/kg(直立姿勢において)
解剖学的デッドスペースを増加させる要因(気道の拡張や長さの増加)
- 深い吸気(Deep inspiration)
- 抗コリン薬(Anticholinergic drugs)
- 陽圧換気(Positive pressure ventilation): 気道圧が増加するため
- 首の伸展と顎の前突(Neck extension and jaw protrusion): デッドスペースが2倍になることがあります
- 姿勢(Posture): 直立姿勢で増加
- 肺気腫(Emphysema): 気道の拡大
- 全身麻酔(General anesthesia): 多因子による(気管支収縮トーンの影響など)
- 麻酔器具/回路(Anesthesia apparatus/circuit)
- 人工気道(Artificial airway)
- 年齢の増加(↑Age): デッドスペースの増加を伴う
- 過換気(Hyperventilation): 乱流が増加し、機能的デッドスペースが増加する
解剖学的デッドスペースの測定
- シングルブレスN2ウォッシュアウト法(Single breath N2 washout method, Fowler’s method)
解剖学的デッドスペースの機能
- 二酸化炭素(CO2)の保持: 血液および間質に重炭酸バッファーが形成されます。
- 吸入空気の温度調節: 体温に調整され、ヘモグロビンの酸素親和性が向上し、酸素の取り込みが改善されます。
- 粒子状物質の捕捉: 粘液で被覆された気道で粒子が捕捉され、粘液線毛輸送によって排除されます。
- 吸入空気の加湿: 気道粘液の質が向上します。
肺胞デッドスペース(Alveolar Dead Space)
- 定義: 吸入されたガスが解剖学的デッドスペースを通過して肺胞レベルのガスと混合しますが、ガス交換に関与しない部分を指します。
肺胞デッドスペースを増加させる要因
- 肺胞灌流の減少(Decrease in alveolar perfusion)
- 例: **肺高血圧症(Pulmonary hypotension)や塞栓症(Embolism)**による非灌流(non-perfusion)
- 非血管性空間の換気(Ventilation of nonvascular air space)
- 例: 閉塞性肺疾患(Obstructive lung disease)
- 姿勢(Posture): 仰臥位(supine position)では減少しますが、影響は軽微です。
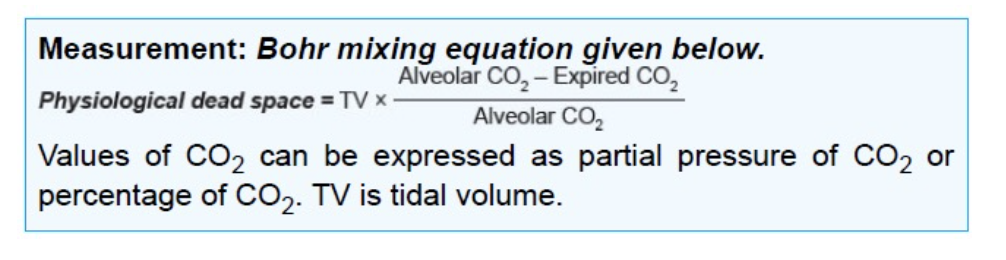
生理的デッドスペース(Physiological Dead Space)
- 定義: **解剖学的デッドスペース(Anatomical dead space)と肺胞デッドスペース(Alveolar dead space)**を合わせたもの。
- 測定: ボーア混合法(Bohr mixing equation)
- Physiological dead space = (Anatomical dead space + Alveolar dead space)
呼吸の仕事(Work of Breathing)
呼吸を行うために必要な仕事は以下の通りです。
- 弾性仕事(Elastic work, Compliance work): 65%
- 組織の弾性(Tissue elasticity): 1/3
- 表面張力の弾性(Surface tension elasticity): 2/3
- 非弾性仕事(Non-elastic work): 35%
- 粘性抵抗(Viscous resistance, tissue resistance): 7%
- 気道抵抗(Airway resistance): 28%
呼吸の仕事が増加する状況
- 気道抵抗(Airway resistance)が増加する:
例: 肺気腫(Emphysema)、喘息(Asthma) - 主要な気道抵抗の部位:
中等度の大きさの気管支(第7世代の気道分岐)である葉気管支および区域気管支(lobar and segmental bronchi) - 気道抵抗が最大になる:
**残気量(RV)**で最大、**肺全体容量(TLC)**で最小
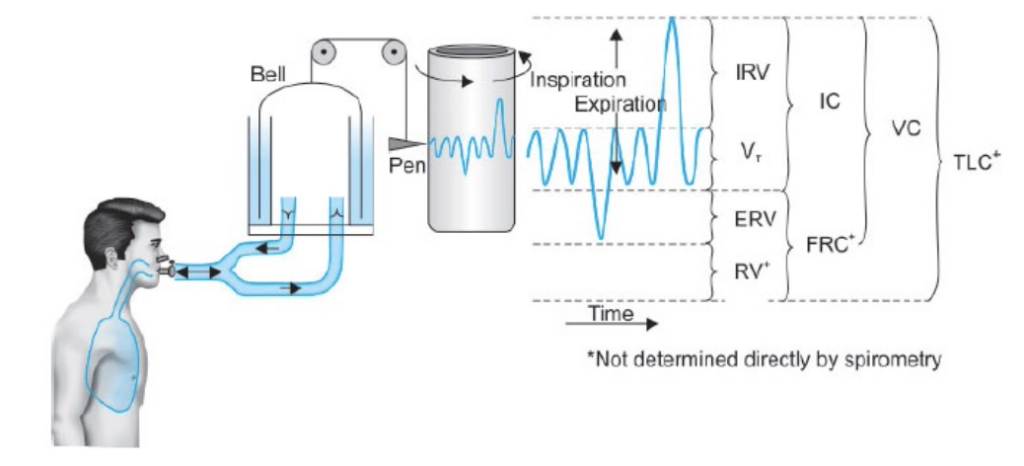
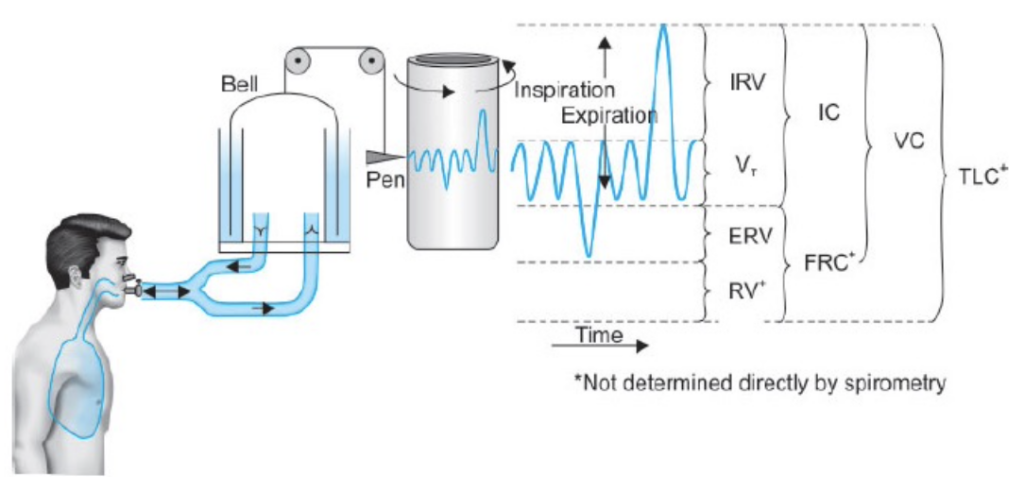
肺の容積と容量(Lung Volumes and Capacities)
肺の容積と容量は、スパイロメーター(spirometer)を用いて測定されます。この測定の記録は**スパイログラム(spirogram)**と呼ばれます。
肺の容積と容量の種類
- 静的肺容積および容量(Static Lung Volumes and Capacities):
時間要素が関与しないもので、mLまたはLで表されます。 - 動的肺容積および容量(Dynamic Lung Volumes and Capacities):
時間依存性があり、mL/minまたはL/minで表されます。
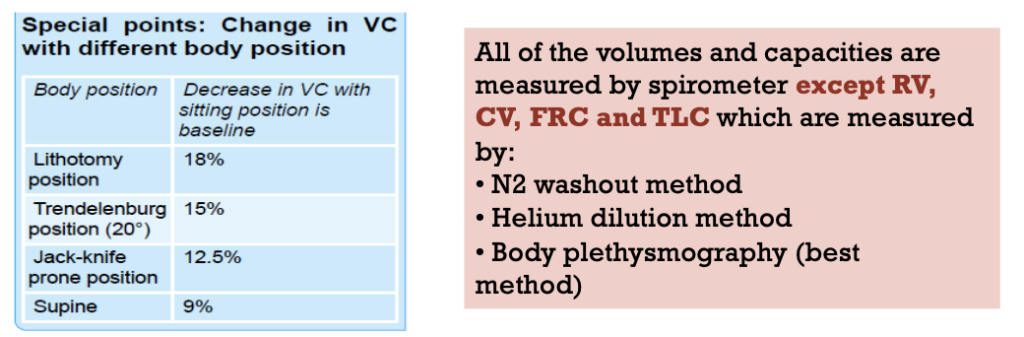
※すべての肺活量や容量はスパイロメーターで測定されますが、残気量 (RV)、肺活量 (CV)、機能的残気量 (FRC)、および総肺容量 (TLC) は、以下の方法で測定されます:
- 窒素排除法 (N2 washout method)
- ヘリウム希釈法 (Helium dilution method)
- ボディプレトリズモグラフィー (Body plethysmography)(最も優れた方法)

静的肺容積および容量
| 測定項目 | 値 (mL) | 定義 |
|---|---|---|
| 一回換気量 (Tidal Volume, TV) | 500-750 | 安静に呼吸する際に1回の呼吸で吸入または呼出される空気の量 |
| 吸気予備量 (Inspiratory Reserve Volume, IRV) | 2000 | 潮気量の吸気に加えて最大努力で吸入できる空気の量 |
| 呼気予備量 (Expiratory Reserve Volume, ERV) | 1000 | 潮気量の呼気に加えて最大努力で呼出できる空気の量 |
| 残気量 (Residual Volume, RV) | 1300 | 最大呼気後に肺内に残る空気の量;呼吸の合間に肺胞を膨らませ、新しい空気と混ざる |
| 測定項目 | 値 (mL) | 定義 |
|---|---|---|
| 全肺気量 (Total Lung Capacity, TLC) | 5000 | 吸気予備量 (IRV) + 潮気量 (TV) + 呼気予備量 (ERV) + 残気量 (RV);肺の全容量、肺のコンプライアンスに依存 |
| 肺活量 (Vital Capacity, VC) | 3500 | 吸気予備量 (IRV) + 潮気量 (TV) + 呼気予備量 (ERV);最大吸気後に最大呼気で排出できる空気の量 |
| 吸気容量 (Inspiratory Capacity, IC) | 2500 | 潮気量 (TV) + 吸気予備量 (IRV);最大吸気で吸入できる空気の量 |
| 呼気容量 (Expiratory Capacity, EC) | 1500 | 潮気量 (TV) + 呼気予備量 (ERV);最大呼気で呼出できる空気の量 |
| 機能的残気量 (Functional Residual Capacity, FRC) | 2500 | 呼気予備量 (ERV) + 残気量 (RV);呼吸の合間に肺に残る空気の量 |
閉塞容積(Closing Volume)
- 閉塞容積とは:
強制呼気(forced expiration)時に、肺の下部依存部分にある肺胞(alveoli)や小細気管支(small bronchioles)が閉じ始める容積のことです。これは、**経肺圧(transpulmonary pressure)の減少によるものです。このときの容積を閉塞容量(closing capacity, CC)**と言います。 - 閉塞容量(CC)の計算:
閉塞容量は、閉塞容積と残気量(Residual Volume, RV)の合計です。
関係式: 閉塞容量 – RV = 閉塞容積 - 加齢と閉塞容量の変化:
閉塞容量は加齢とともに増加し、直立姿勢では66歳、仰臥位(supine posture)では44歳で**機能的残気量(Functional Residual Capacity, FRC)**に等しくなります。 - 正常な若年成人における閉塞容量:
CC < FRC
66歳時点: CC ≈ FRC - 若年者における閉塞容量:
- 直立姿勢: FRCの50%
- 仰臥位: FRCの66%
- 小気道疾患を患う人の場合:
CC > FRC
閉塞容積と解剖学的デッドスペースの測定方法
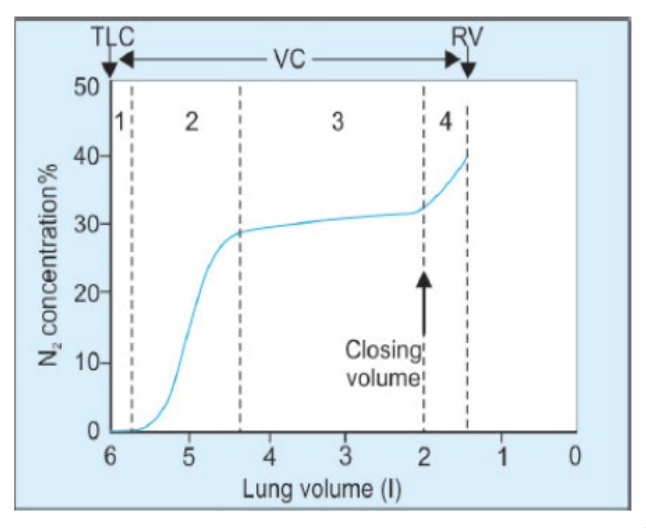
シングルブレスN2ウォッシュアウト法(Single-Breath N2 Washout Method)
- 手順:
被験者は中間吸気の状態から純酸素(O2)を深く吸い込み、その後、一定速度で呼気を行います。この間に、呼気中の窒素(N2)濃度の変化を測定し、カーブの各相(I-IV)を確認します。
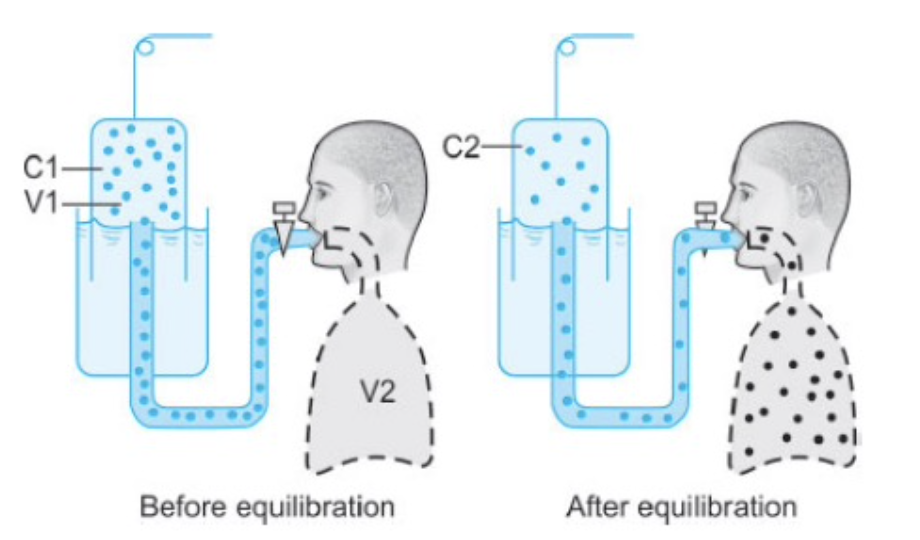
ヘリウム希釈法(Helium Dilution Method)
- 手順:
被験者は、既知の容積(V1)と既知の濃度(C1)のヘリウムを含むスパイロメーターに接続されます。ヘリウムは血液にほとんど溶け込まないため、肺内の未知の容積(V2)を測定できます(この容積はFRCやRVである可能性があります)。 - 平衡:
数回の呼吸の後、スパイロメーターと肺内のヘリウム濃度が等しくなります。この時点でヘリウムが失われていないため、平衡前のヘリウム量(濃度×容積)はC1 × V1になります。 - 計算:
平衡後のヘリウム濃度がC2の場合、以下の関係式を使用します。
C1×V1=C2×(V1+V2)C1
これを用いて、肺内の未知の容積(V2)を求めることができます。
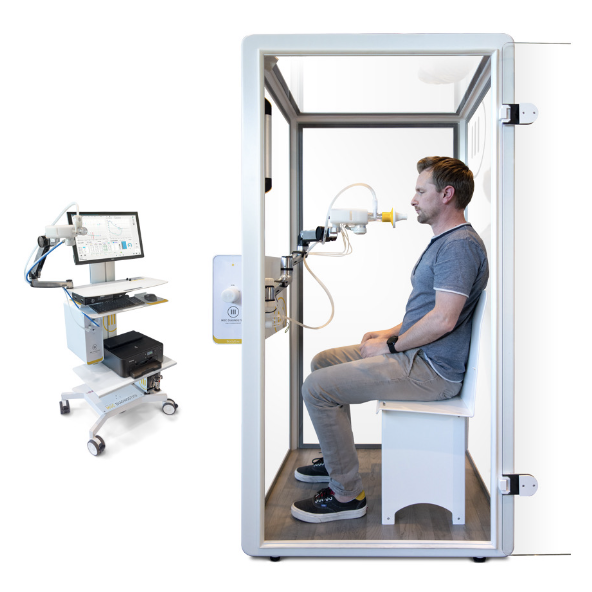
ボディプレチスモグラフ(Body Plethysmograph)
装置の概要:
- ボディプレチスモグラフは、密閉された大きな箱(昔の電話ボックスのようなもの)で、被験者が中に座ります。通常の呼気の終わり(肺容量が**機能的残気量(Functional Residual Capacity, FRC)**にある時)に、マウスピースのシャッターが閉じられ、被験者は呼吸努力を行います。
操作の流れ:
- 被験者が吸気を試みると、肺内のガスが膨張し、肺容量が増加します。その結果、箱内のガス量が減少し、箱内の圧力が上昇します。
- **ボイルの法則(Boyle’s law)**によると、圧力(Pressure)×体積(Volume)は一定(温度が一定の場合)です。
- よって、吸気前後の箱の圧力をそれぞれP1とP2、吸気前の箱の体積をV1、箱の体積変化をΔVとすると、次の式が成り立ちます。 P1×V1=P2×(V1−ΔV)P1
- このΔVは、箱内の体積が減少した分であり、同じ体積(ΔV)が肺内でも増加しています。
- 次に、ボイルの法則を肺内のガスに適用します。ここで、吸気前後の口内圧力をそれぞれP3とP4、実験開始時の肺容量をV2とすると、次の式が成り立ちます。 P3×V2=P4×(V2+ΔV)P3 \times V2 = P4 \times (V2 + ΔV)P3×V2=P4×(V2+ΔV)
- この式を用いて、FRCを求めることができます。
式の意味
- 変数の定義:
- P1: 吸気前の箱の圧力
- V1: 吸気前の箱の体積
- ΔV: 吸気による箱の体積変化
- P2: 吸気後の箱の圧力
- 式の説明:
- 吸気前の箱の圧力 P1P_1P1 と体積 V1V_1V1 の積は、吸気後の圧力 P2P_2P2 と体積 V1−ΔVV_1 – \Delta VV1−ΔV の積に等しい、ということを示しています。
具体的な流れ:
- 吸気前の状態:
- 箱の圧力は P1P_1P1、体積は V1V_1V1 です。この時点での圧力と体積の積は P1×V1P_1 \times V_1P1×V1 です。
- 吸気後の状態:
- 吸気によって箱の体積が ΔV\Delta VΔV だけ変化し、体積は V1−ΔVV_1 – \Delta VV1−ΔV になります。この時の圧力は P2P_2P2 です。吸気後の圧力と体積の積は P2×(V1−ΔV)P_2 \times (V_1 – \Delta V)P2×(V1−ΔV) です。
- 圧力と体積の関係:
- 吸気前と吸気後で、圧力と体積の積が等しいので、次のような式が成り立ちます: P1×V1=P2×(V1−ΔV)P_1 P1×V1=P2×(V1−ΔV)
動的肺容積および容量(Dynamic Lung Volumes and Capacities)
強制肺活量(Forced Vital Capacity, FVC)または時間肺活量(Timed Vital Capacity):
- 最大の吸気の後、できるだけ「強く」かつ「速く」呼気することによって呼出される空気の最大容積。
- **肺活量(Vital Capacity, VC)**に似ていますが、FVCは「速く、強制的な」呼気である点が異なります。
FVCの構成要素:
- FEV1(強制呼気量1秒量, Forced Expiratory Volume in 1 Second): FVCのうち1秒間で呼出される容積。通常、FVCの80%です。
- FEV2: 2秒間で呼出されるFVCの容積。通常95%です。
- FEV3: 3秒間で呼出されるFVCの容積。通常99-100%です。
分時換気量(Minute Ventilation, MV)または肺換気量(Pulmonary Ventilation, PV):
- 1回換気量(Tidal Volume, TV) × 呼吸回数(Respiratory Rate, RR) = 500 mL × 12 回/分 = 6000 mL/分
肺胞換気量(Alveolar Ventilation):
- (TV – デッドスペース(Dead Space)) × RR = (500 mL – 150 mL)× 12 回/分 = 4200 mL/分
弾性反動(Elastic Recoil)とコンプライアンス(Compliance)
弾性反動(Elastic Recoil):
- 弾性反動とは、伸展または膨張した肺がその静止容量(機能的残気量(Functional Residual Capacity, FRC))に戻る能力を指します。
- 肺の硬さに直接関連しており、肺が硬ければ硬いほど、弾性反動は大きくなります(しかし、コンプライアンスは低下します)。
- **機能的残気量(FRC)**は、肺の弾性反動と胸壁の弾性反動が均衡している(つまり、等しい力で反対方向に作用している)時の肺容量です。しばしば肺の静止容量と呼ばれます。
- 肺の弾性反動が増加する(すなわち、コンプライアンスが低下する)と、FRCが減少します。
- 胸壁の弾性反動が増加すると、FRCが増加します。
- 若年者において、低肺容量での胸壁の弾性反動は、**残気量(Residual Volume, RV)**の主要な決定因子です。
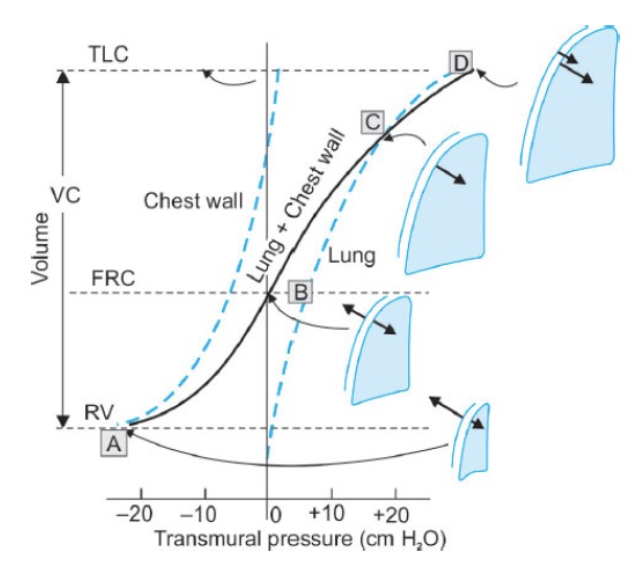
- 胸壁の弾性反動は、もし肺の弾性反動によって抑制されなければ、胸壁は**総肺容量(Total Lung Capacity, TLC)**の約70%まで拡張します。この体積は、肺によって抑制されていない胸壁の静止位置を示します。胸壁がその静止位置を超えて機械的に拡張されると、内向きに反動します。
- TLCの70%未満の体積では、胸壁の弾性反動は外向きであり、肺の弾性反動とは反対方向に作用します。胸壁の外向きの弾性反動は、RVで最も大きく(図9.6のポイントA)、肺の内向きの弾性反動はTLCで最も大きくなります(ポイントD)。
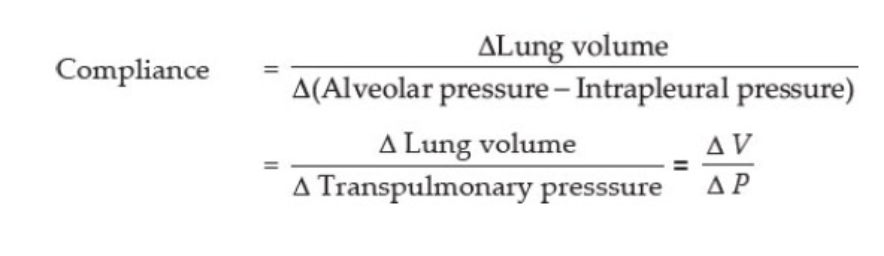
コンプライアンス(Compliance):
- コンプライアンスは、圧力の単位変化に対する体積の変化として定義されます。
- 肺の伸展性や伸びやすさを測定します。
- 肺の正常なコンプライアンスは、150-200 mL/cm H2Oです。これは、1 cm H2Oの圧力変化が200 mLの肺容量変化を引き起こすことを示しています。
- 胸壁単独のコンプライアンスは200 mL/cm H2Oです。
- **肺と胸壁の合計コンプライアンス(呼吸システムのコンプライアンス)**は通常、70-85 mL/cm H2Oです。
コンプライアンスの種類
- 静的コンプライアンス(Static Compliance):
- 呼吸の異なるフェーズの影響を考慮せずに測定されます。
- 動的コンプライアンス(Dynamic Compliance):
- 呼吸の異なるフェーズにおけるコンプライアンスの測定です。
- 特異コンプライアンス(Specific Compliance):
- コンプライアンスを**機能的残気量(FRC)**で割った値です。
静的コンプライアンス(Static Compliance)
- 静的コンプライアンスの測定は、**圧力-体積曲線(Pressure-Volume Curve)**の傾きにより決定されます。
- コンプライアンスが高い肺は、圧力-体積曲線の傾きが急になります。
- 肺うっ血(Pulmonary Congestion)や間質性肺線維症(Interstitial Pulmonary Fibrosis)では、肺が硬くなり瘢痕化するため、曲線は下方および右方向にシフトし、コンプライアンスが低下します。
- **肺気腫(Emphysema)**では、弾性組織が破壊されるため、曲線は上方および左方向にシフトし、コンプライアンスが増加します。
- 静的コンプライアンスと動的コンプライアンスの両方が低下する場合、それは肺が硬くなっていることを意味します。
- 例えば:
- 肺水腫(Pulmonary Edema)
- 肺胞コンソリデーション(Consolidation)
- 無気肺(Atelectasis)
- 胸水(Pleural Effusion)
- 気胸(Pneumothorax)
- 例えば:

- 動的コンプライアンスのみが低下し、静的コンプライアンスがほぼ正常である場合、それは気道が閉塞していることを示します。
- 例えば:
- 気管内チューブの閉塞(Endotracheal Tube Obstruction)
- 熱湿交換器の閉塞(Heat Moisture Exchanger Blockage)
- 気管支痙攣(Bronchospasm)
- 例えば:
静的コンプライアンスが影響を受ける状態
- コンプライアンスが低下する状態:
- 肺うっ血、肺線維症など
- コンプライアンスが増加する状態:
- 肺気腫、老化、喘息(Asthma)、および軽度の慢性気管支炎(Chronic Bronchitis)
注: 肺気腫や老化に伴う肺の弾性組織の破壊が、コンプライアンス増加の主な原因と考えられますが、喘息発作時にコンプライアンスが増加する理由は明確ではありません。
| コンプライアンスの変化 | 状態 | 理由の機序 |
|---|---|---|
| コンプライアンスが低下する状態 | 肺うっ血(Pulmonary Congestion) | 肺うっ血では、肺の血液量が増加し、肺内の圧力が高まります。これにより肺の弾力性が損なわれ、コンプライアンスが低下します。 |
| 肺線維症(Pulmonary Fibrosis) | 肺線維症では、肺組織が線維化し硬化します。これにより肺が硬くなり、膨張が難しくなるため、コンプライアンスが低下します。 | |
| コンプライアンスが増加する状態 | 肺気腫(Emphysema) | 肺気腫では、肺胞壁が破壊され、肺組織が弾力性を失います。肺の膨張が容易になり、コンプライアンスが増加します。 |
| 老化(Aging) | 老化により、肺組織が弾力性を失い、肺が弛緩しやすくなります。これによりコンプライアンスが増加します。 | |
| 喘息(Asthma) | 喘息では気道が狭窄し、気道の抵抗が増加しますが、肺組織自体は比較的弛緩しており、相対的にコンプライアンスが増加することがあります。 | |
| 軽度の慢性気管支炎(Chronic Bronchitis) | 軽度の慢性気管支炎では気道の炎症が慢性的に続きますが、肺組織が過度に弛緩していることがあり、結果としてコンプライアンスが増加することがあります。 |
動的コンプライアンス(Dynamic Compliance)
- 動的コンプライアンスは、呼吸中に気道を通る空気が流れているときに測定されます。
- この測定は、肺および胸壁の硬さだけでなく、肺を膨らませるために働かなければならない気道抵抗も反映します。
- 動的コンプライアンスは、静的コンプライアンス(肺と胸壁の硬さ)と気道抵抗の合計、すなわち肺のインピーダンスを示します。
- 静的コンプライアンスは呼吸器系の弾力性を反映し、動的コンプライアンスはインピーダンスを反映します。
- 両方が硬い場合、静的と動的コンプライアンスの両方が低下します。
- 高い気道抵抗は動的コンプライアンスを低下させます。
重要ポイント:
- **肺気腫(Emphysema)**では、気道の閉塞により動的コンプライアンスが低下しますが、弾性組織の喪失により静的コンプライアンスが増加します。
肺胞の表面張力(Alveolar Surface Tension)
- 肺胞の表面は湿っており、空気と接触しているため、大きな空気-液体界面が作られます。
- この界面の張力を**表面張力(Surface Tension)**と呼びます。
- 単位は dyne/cm で測定されます。
- 水分子は空気分子よりも強く引き寄せられるため、表面張力が生じます。
- この張力は内向きの力を生じ、肺胞の直径を減少させる傾向があります。
- 表面張力と肺のコンプライアンスには逆の関係があります。表面張力が除去されると、肺のコンプライアンスは大幅に向上します。
例:
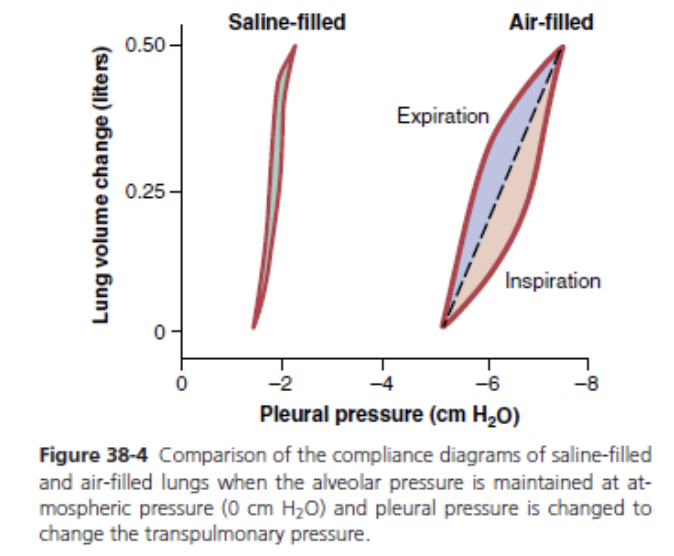
- 空気で満たされた肺では、ガス-液体界面が表面張力を生じます。
- しかし、生理食塩水で満たされた肺では、空気-液体界面が除去され、表面張力も除去されます。
- そのため、生理食塩水(液体)で満たされた肺のコンプライアンスは、正常な肺よりも高くなります。
サーファクタント(Surfactant)による表面張力の低下
- サーファクタントは、90%が脂質、10%がタンパク質で構成されています。
- 主にタイプII肺胞上皮細胞(Type II Alveolar Epithelial Cells)によって産生され、肺胞内腔にエキソサイトーシスにより分泌されます。
- 主な脂質は、ジパルミトイルホスファチジルコリン(Dipalmitoylphosphatidylcholine、別名レシチン、Lecithin)で、全脂質の62%を占めます。
- 特徴的なタンパク質は4種類あります:
- サーファクタントプロテインA(SP-A)
- サーファクタントプロテインB(SP-B)
- サーファクタントプロテインC(SP-C)
- サーファクタントプロテインD(SP-D)
- SP-Cの遺伝子に変異があると、家族性間質性肺疾患(Familial Interstitial Lung Disease)と関連があることが報告されています。
サーファクタントの機能
- 肺胞の虚脱防止: サーファクタントは肺胞の表面張力を低下させ、肺胞が潰れないようにします。
- 肺水腫の防止: 表面張力を減少させることで、肺に水分が溜まるのを防ぎます。
- 呼吸の負担軽減: 呼吸時の作業負担を減らします。
※
肺水腫を防ぐために「表面張力を減少させる」という機序は、肺胞の内側にある界面活性剤(サーファクタント)の機能に関連しています。以下にその機序を説明します:
- 表面張力と肺胞の役割
表面張力: 液体の表面で、液体分子が互いに引き合う力です。肺胞内の液体(肺胞液)には高い表面張力があります。この力が強いと、肺胞の壁が引き寄せられ、肺胞がつぶれやすくなります。
肺胞: 肺の最小単位であり、酸素と二酸化炭素の交換が行われる場所です。肺胞の内壁には液体が少し存在しており、これがガス交換の効率を助けます。
- サーファクタントの役割
サーファクタント: 肺胞の内側に存在する物質で、主に脂質とタンパク質から成ります。サーファクタントは、肺胞の内壁に均等に広がり、表面張力を低下させる役割を果たします。
表面張力の低下: サーファクタントが肺胞内の液体表面に広がることで、表面張力が低下します。これにより、肺胞の内壁がつぶれにくくなり、肺胞が膨らみやすくなります。結果として、肺胞が潰れにくくなり、ガス交換が効率よく行われます。
- 肺水腫との関係
肺水腫の発生: 肺水腫は、肺胞や肺間質に過剰な液体が蓄積する状態です。これにより、ガス交換が阻害され、呼吸困難や酸素不足が生じます。
サーファクタントの不足: サーファクタントの量が不足したり、機能が低下すると、表面張力が高くなり、肺胞が潰れやすくなります。このため、肺水腫のリスクが増す可能性があります。サーファクタントが正常に機能していると、肺胞が適切に膨らみ、過剰な液体の蓄積を防ぐ手助けをします。
サーファクタントの働きと表面張力
- 表面張力は、単位面積あたりのサーファクタント濃度に逆比例します。
- 吸気時に肺胞が拡張すると、サーファクタント分子は離れ、表面張力が増します。
- 呼気時にはサーファクタント分子が近づき、表面張力が減少します。
- 低肺容量で表面張力が低くなります。
発生と変化
- サーファクタントの産生は妊娠20〜24週目から始まり、35〜37週目に成熟します。
- 妊娠28〜32週目に羊水中に現れます。
- 喫煙や長期の純酸素療法は、サーファクタントを減少させ、また変化させることがあります。
- サーファクタント欠乏症は新生児において、ヒアリン膜疾患(Hyaline Membrane Disease、HMD)や乳児呼吸窮迫症候群(Infant Respiratory Distress Syndrome、IRDS)として知られています。
制限性疾患(Restrictive Disease)
定義:
- 吸気時に肺の膨張が困難で、肺の拡張に制限がかかる疾患です。これは、肺の膨張に必要なスペースが減少するためです。
- 純粋な制限性疾患は気道抵抗に影響を与えません。
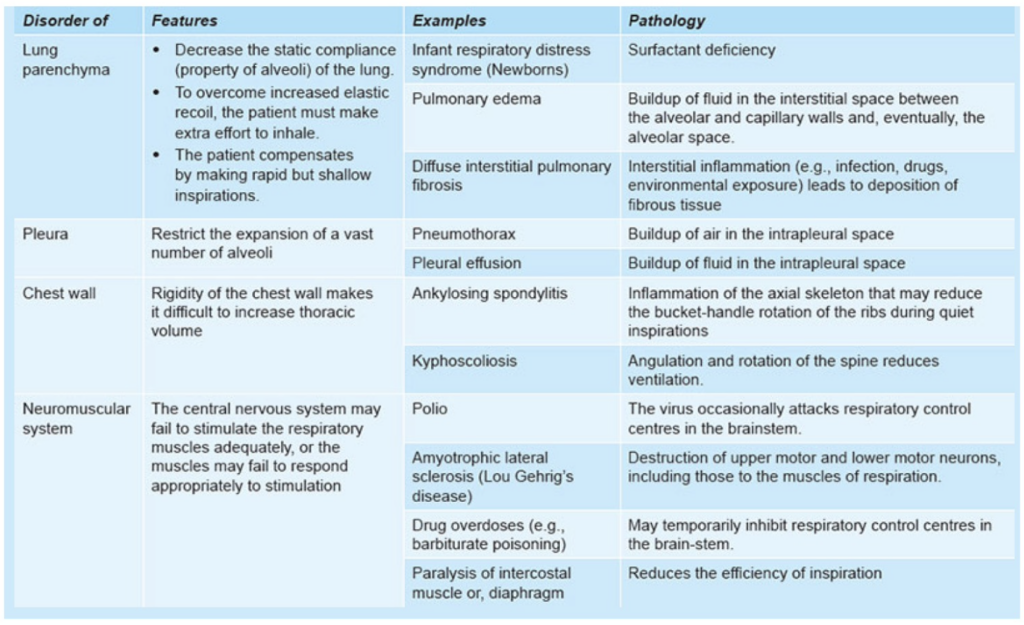
- 制限性疾患は、肺実質(lung parenchyma)または肺実質以外の三つの構造(胸膜(pleura)、胸壁(chest wall)、神経筋系(neuromuscular system))に影響を与える可能性があります。
| カテゴリー | 状態 | 病理 | 解説 |
|---|---|---|---|
| 肺実質 | 新生児呼吸窮迫症候群 (Infant Respiratory Distress Syndrome) | サーファクタント不足 (Surfactant Deficiency) | サーファクタントが不足し、肺胞の表面張力が高くなることで肺胞が潰れ、ガス交換が困難になります。 |
| 肺実質 | 肺水腫 (Pulmonary Edema) | 肺胞と毛細血管壁間の間質液の蓄積 (Buildup of fluid in the interstitial space between alveolar and capillary walls) | 液体が肺胞間質に蓄積し、最終的には肺胞内にも入り込み、呼吸困難やガス交換の障害を引き起こします。 |
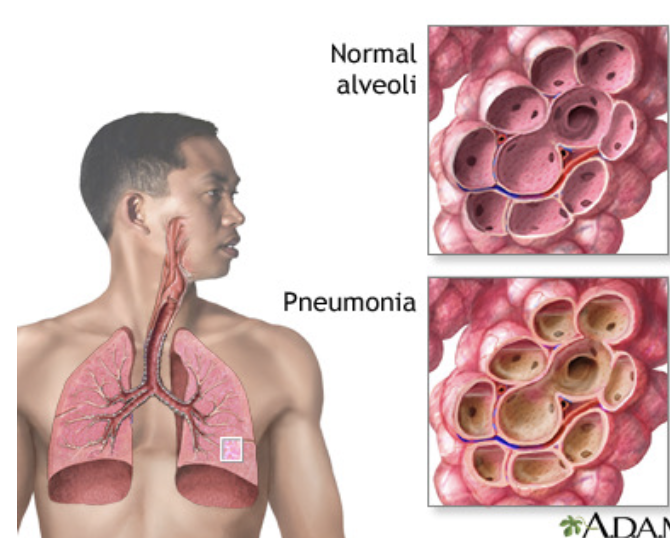
| 肺実質 | びまん性間質性肺炎 (Diffuse Interstitial Pulmonary Disease) | 間質性炎症(感染、薬物、線維症など) (Interstitial inflammation, e.g., infection, drugs, fibrosis) | 間質に炎症が広がり、線維化が進行することで肺の弾力性が低下し、呼吸困難を引き起こします。 |
| 胸膜 | 気胸 (Pneumothorax) | 胸膜腔内の空気の蓄積 (Buildup of air in the intrapleural space) | 胸膜腔内に空気が蓄積し、肺が圧迫されて収縮することで呼吸が困難になります。 |
| 胸膜 | 胸水 (Pleural Effusion) | 胸膜腔内の液体の蓄積 (Buildup of fluid in the intrapleural space) | 胸膜腔内に液体が蓄積し、肺の拡張が制限されることで呼吸困難を引き起こします。 |
| 胸壁 | 強直性脊椎炎 (Ankylosing Spondylitis) | 脊椎の炎症が肋骨のバケットハンドル運動を制限 (Inflammation of the axial skeleton affecting rib movement) | 胸郭の動きが制限され、呼吸時の肺の拡張が難しくなります。 |
| 胸壁 | 後弯症・側弯症 (Kyphoscoliosis) | 脊柱の角度変化と回転が換気を減少させる (Angulation and rotation of the spine reduce ventilation) | 背骨の変形により胸郭の形が変わり、肺の拡張が難しくなります。 |
| 神経筋系 | ポリオ (Polio) | 脳幹の呼吸制御中枢が攻撃されることがある (Virus occasionally attacks respiratory control centres in the brainstem) | 脳幹にある呼吸制御中枢が影響を受け、呼吸の制御が困難になります。 |
| 神経筋系 | 筋萎縮性側索硬化症 (Amyotrophic Lateral Sclerosis) | 上位運動ニューロンおよび下位運動ニューロンの破壊 (Destruction of upper and lower motor neurons, including those for respiration) | 呼吸に関わる筋肉の運動ニューロンが破壊され、呼吸の効率が低下します。 |
| 神経筋系 | 薬物過剰摂取 (Drug Overdoses) | 呼吸中枢の一時的な抑制 (Temporary inhibition of respiratory control centres) | 一部の薬物(例:バルビツール酸塩)によって呼吸中枢が抑制され、呼吸が浅くなることがあります。 |
閉塞性疾患(Obstructive Disease)
定義:
- 気道が部分的または完全に閉塞することによって、気流が減少する疾患です。
- 閉塞は気道の内腔の狭窄から来る場合もあれば、気道を取り巻く肺実質の弾性回復力が低下して内腔の口径が減少することによっても起こります。
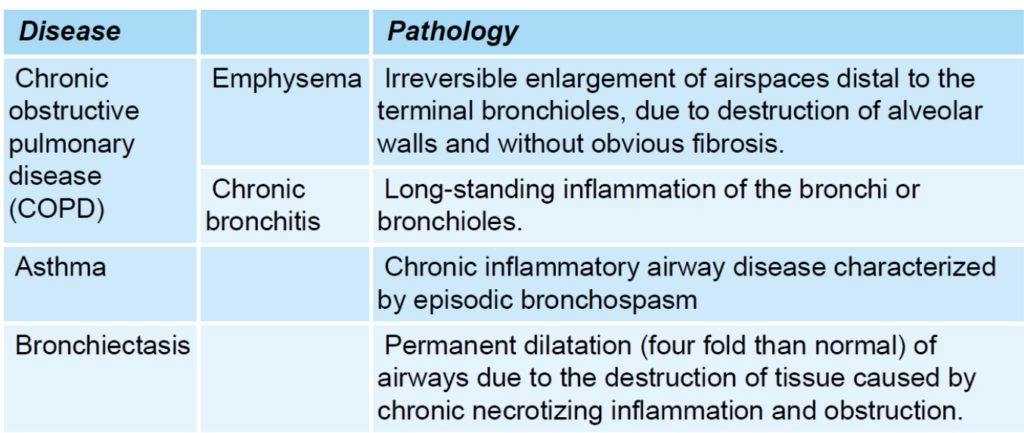
| 病名 | 病理 |
|---|---|
| 肺気腫 (Emphysema) | 終末細気管支以降の空気空間の不可逆的な拡張で、肺胞壁の破壊によるもので、明らかな線維症は見られません。 |
| 慢性気管支炎 (Chronic Bronchitis) | 気管支や細気管支の長期的な炎症。 |
| 喘息 (Asthma) | 発作的な気管支収縮を特徴とする慢性炎症性気道疾患。 |
| 気管支拡張症 (Bronchiectasis) | 慢性的な壊死性炎症と閉塞による組織の破壊で、気道が通常の4倍に拡張します。 |
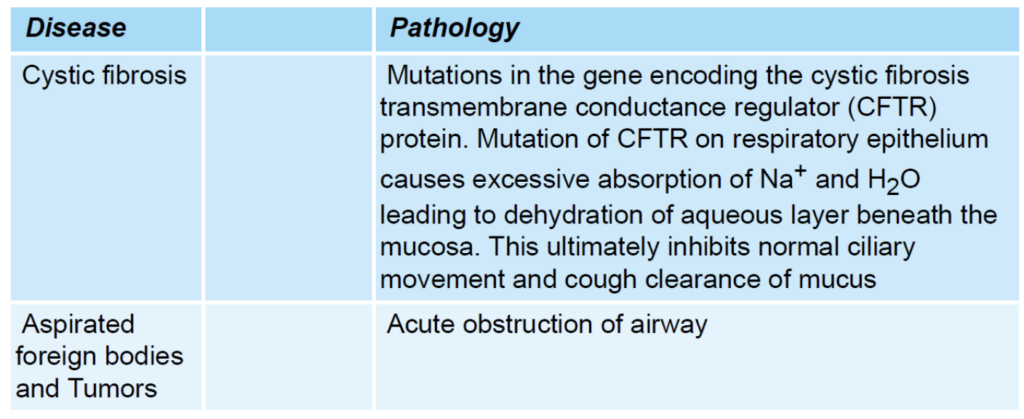
| 嚢胞性線維症 (Cystic Fibrosis) | CFTR(嚢胞性線維症膜伝導調節因子)タンパク質の遺伝子変異により、Na*とH2Oの過剰吸収が引き起こされ、粘膜下の液体層が脱水状態になり、正常な線毛運動と咳による粘液の排除が抑制されます。 |
| 急性気道閉塞 (Acute Airway Obstruction) | 気道の急性閉塞。 |
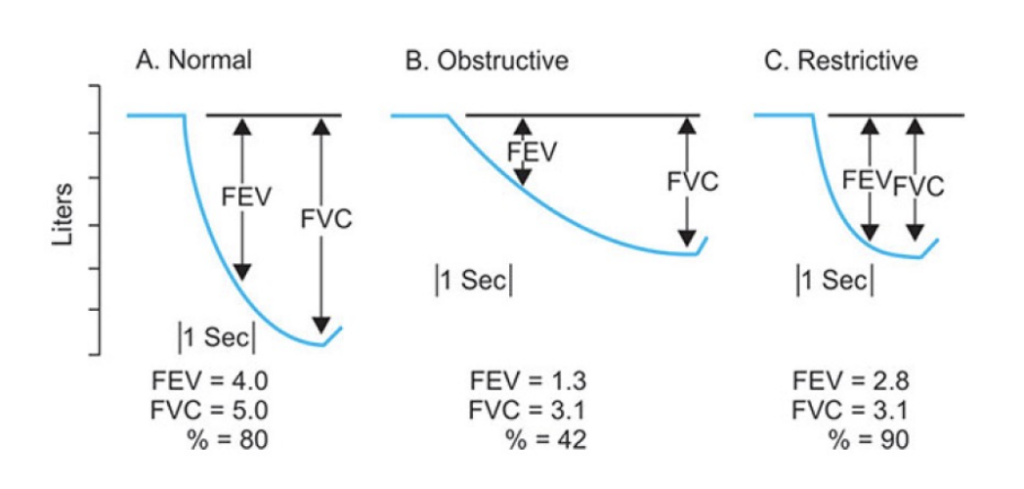
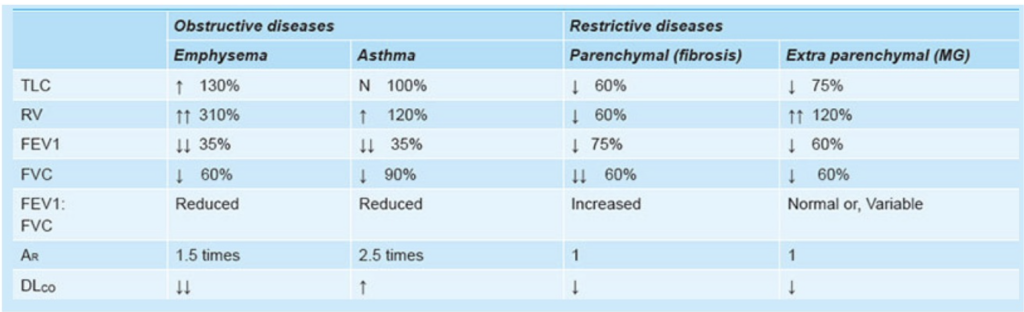
閉塞性疾患と制限性疾患の違い
- 閉塞性疾患(Obstructive Disease):
- **FEV1(強制呼気量1秒)とFVC(強制肺活量)**がともに減少しますが、FEV1の減少がFVCの減少よりも大きいです。結果として、FEV1/FVC比が減少します。
- **ピーク呼気流量(PEF)**が低く、呼気フロー量曲線が内側に凹む「スクープドアウト」な外観を示します。
- **総肺容量(TLC)と残気量(RV)**が高いです。
- 制限性疾患(Restrictive Disease):
- FEV1とFVCがともに減少しますが、FVCの減少がFEV1の減少よりも大きいです。結果として、FEV1/FVC比が増加します。
- **ピーク呼気流量(PEF)**が正常か高めで、呼気フロー量曲線において、努力に依存しない部分は抑制されません。
- **総肺容量(TLC)と残気量(RV)**が低いです。
| 項目 | 閉塞性疾患(Obstructive Disease) | 制限性疾患(Restrictive Disease) | 理由 |
|---|---|---|---|
| FEV1(強制呼気量1秒) | 減少しますが、FVCの減少よりも大きいです。 | 減少しますが、FVCの減少がFEV1の減少よりも大きいです。 | 閉塞性疾患では気道が狭くなるため、呼気が困難になりFEV1が大幅に減少します。制限性疾患では肺が硬くなるため、呼気量が全体的に減少しますが、FVCがより大きく減少します。 |
| FVC(強制肺活量) | 減少しますが、FEV1の減少よりも小さいです。 | 減少しますが、FEV1の減少よりも大きいです。 | 気道の閉塞により空気が完全に吐き出せないためFVCが減少しますが、閉塞性疾患ではFEV1の減少が相対的に大きいです。制限性疾患では肺の伸展性が低下し、FVCがより大きく減少します。 |
| FEV1/FVC比 | 減少します。 | 増加します。 | 閉塞性疾患ではFEV1の減少がFVCの減少よりも大きいため、比率が低下します。制限性疾患ではFVCの減少が大きく、FEV1とFVCの比率が増加します。 |
| ピーク呼気流量(PEF) | 低く、呼気フロー量曲線が内側に凹む「スクープドアウト」な外観を示します。 | 正常か高めで、呼気フロー量曲線において、努力に依存しない部分は抑制されません。 | 閉塞性疾患では気道が狭くなり、呼気流量が低下するため、PEFも低下します。制限性疾患では肺の硬さが増すため、PEFは正常か高めで、呼気フロー曲線が正常に保たれます。 |
| 総肺容量(TLC) | 高いです。 | 低いです。 | 閉塞性疾患では肺に空気が閉じ込められ、総肺容量が増加します。制限性疾患では肺の膨張能力が制限され、総肺容量が低下します。 |
| 残気量(RV) | 高いです。 | 低いです。 | 閉塞性疾患では空気が肺内に閉じ込められ、残気量が増加します。制限性疾患では肺の拡張が制限され、残気量も減少します。 |
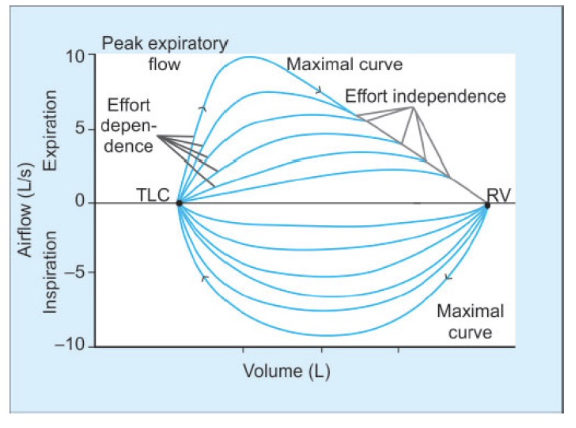
流量-容量曲線(Flow-Volume Curve)
- 努力依存性: 高肺容量では努力に依存し、低肺容量では努力に依存しない。
- **ピーク呼気流量(PEF)**は最大呼気曲線における最も高い流量です。
- 制限性疾患では、曲線が全体的に低下し、TLCとRVが低いことが特徴です。
- 閉塞性疾患では、曲線が内側に凹み、TLCとRVが高いです。
閉塞性疾患 (Obstructive Disease)
- 曲線の形状: 呼気流量-容量曲線は「スクープアウト(scooped-out)」のような形を示します。これは、呼気の終わりに流量が急激に低下するためです。努力に関係なく、どの相対的な肺容量でも流量が低くなります。
- 肺容量: 総肺容量(Total Lung Capacity, TLC)および残気量(Residual Volume, RV)が高くなります。これは、気道が狭くなることによって呼気が制限され、空気が肺に長くとどまるためです。
- 特徴: 努力に依存しない部分が内側に凹むことで、気道が狭くなっていることが示されます。
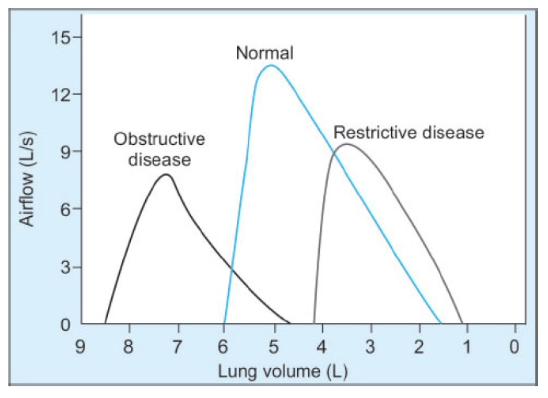
拘束性疾患 (Restrictive Disease)
- 曲線の形状: 呼気流量-容量曲線は、努力に依存しない部分が凹むことはありません。流量-容量曲線は、気道が狭くなっている場合には非常に有用です。
- 肺容量: 総肺容量(Total Lung Capacity, TLC)および残気量(Residual Volume, RV)が低くなります。これは、肺の拡張が制限されているためです。
- 特徴: 努力に依存しない部分が凹むことはなく、肺の機能制限が明確に示されます。
まとめ
- 閉塞性疾患: 呼気流量-容量曲線が「スクープアウト」の形を示し、高いTLCとRVを持つ。気道閉塞によって流量が減少します。
- 拘束性疾患: 曲線は凹まないが、TLCとRVが低く、肺の拡張が制限されることで示されます。
PULMONARY CIRCULATION, PULMONARY EDEMA, PLEURAL FLUID
肺循環についての解説:
1. 高圧・低流量の循環 (High-Pressure, Low-Flow Circulation):
このタイプの肺循環は、主に肺自体の構造に血液を供給するシステムであり、全身動脈血 (Systemic Arterial Blood) を供給します。以下の部分に血液を供給します。
- 気管 (Trachea)
- 気管支樹 (Bronchial Tree)、特に終末細気管支 (Terminal Bronchioles)
- 肺の支持組織 (Supporting Tissues of the Lung)
- 肺動脈と静脈の外膜 (Adventitia of the Pulmonary Arteries and Veins)
気管支動脈 (Bronchial Arteries) は、この高圧・低流量の循環において重要な役割を果たします。これらの動脈は、大動脈圧より少し低い圧力で、肺に全身動脈血を供給します。
2. 低圧・高流量の循環 (Low-Pressure, High-Flow Circulation):
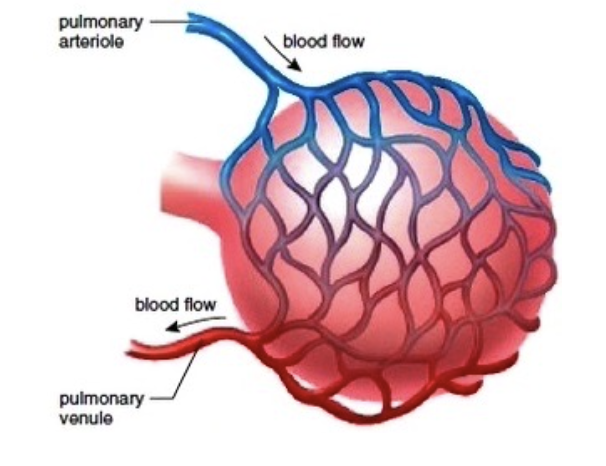
この循環システムは、身体の全ての部分からの静脈血 (Venous Blood) を肺胞毛細血管 (Alveolar Capillaries) に供給し、そこで酸素 (O2) が追加され、二酸化炭素 (CO2) が除去されます。具体的には次のように機能します。
- 肺動脈 (Pulmonary Artery): 右心室 (Right Ventricle) から血液を受け取り、これを肺胞毛細血管へ運びます。ここでガス交換が行われます。
- 肺静脈 (Pulmonary Veins): ガス交換が行われた血液を左心房 (Left Atrium) に戻し、左心室 (Left Ventricle) から全身循環 (Systemic Circulation) へ送られます。
| 循環タイプ | 高圧・低流量の循環 (High-Pressure, Low-Flow Circulation) | 低圧・高流量の循環 (Low-Pressure, High-Flow Circulation) |
|---|---|---|
| 役割 | 肺の構造に血液を供給し、肺の組織や気道に栄養を届ける | 身体全体から静脈血を肺に送り、酸素と二酸化炭素の交換を行う |
| 血液の供給先 | – 気管 (Trachea) – 気管支樹 (Bronchial Tree) – 肺の支持組織 (Supporting Tissues of the Lung) – 肺動脈と静脈の外膜 (Adventitia of the Pulmonary Arteries and Veins) | – 肺胞毛細血管 (Alveolar Capillaries) – 肺動脈 (Pulmonary Artery) – 肺静脈 (Pulmonary Veins) |
| 血流の特徴 | 高圧で流量は低い | 低圧で流量は高い |
| 主な血管 | 気管支動脈 (Bronchial Arteries) | 肺動脈 (Pulmonary Artery) 肺静脈 (Pulmonary Veins) |
肺循環系における圧力 (Pressure in the Pulmonary System):
- 右心室 (Right Ventricle): 右心室の収縮期圧 (Systolic Pressure) は約25 mmHgです。一方、拡張期圧 (Diastolic Pressure) は約0~1 mmHgです。これらの値は左心室に比べて約5分の1です。
右心室と左心室の圧力の違い
- 循環系の構造と機能:
- 右心室は肺循環 (Pulmonary Circulation) を担っています。右心室から肺動脈を通して血液が肺へ送られます。この循環系は、比較的短い距離で血液を送り、低い抵抗で血流が流れるため、圧力が低くて済みます。
- 左心室は全身循環 (Systemic Circulation) を担当しています。左心室から大動脈を通して全身に血液を送り出します。この循環系は長い距離と高い抵抗があるため、より高い圧力が必要です。
- 血管抵抗の違い:
- 肺循環は肺動脈が広く、抵抗が低いため、右心室からの血液は低圧で済みます。
- 全身循環は動脈が細く、抵抗が高いため、左心室は高圧を発生させて血液を全身に送り出します。
- 心臓のポンプ機能:
- 右心室は血液を肺動脈に送り出す際、比較的少ない力で済みます。肺循環の圧力は全身循環に比べて低いため、右心室の圧力も低く設定されています。
- 左心室は全身に血液を送り出すため、強い収縮力が必要です。そのため、左心室の圧力は右心室よりも高いです。
圧力の具体的な値
- 右心室の収縮期圧は約25 mmHgで、肺動脈を通じて血液を肺へ送り出すために必要な圧力です。
- 右心室の拡張期圧は約0〜1 mmHgで、心室が拡張して血液を受け入れる際の圧力です。
これに対し、左心室は全身への血液供給のために高い圧力を発生させる必要があるため、その圧力は右心室の約5倍になります。
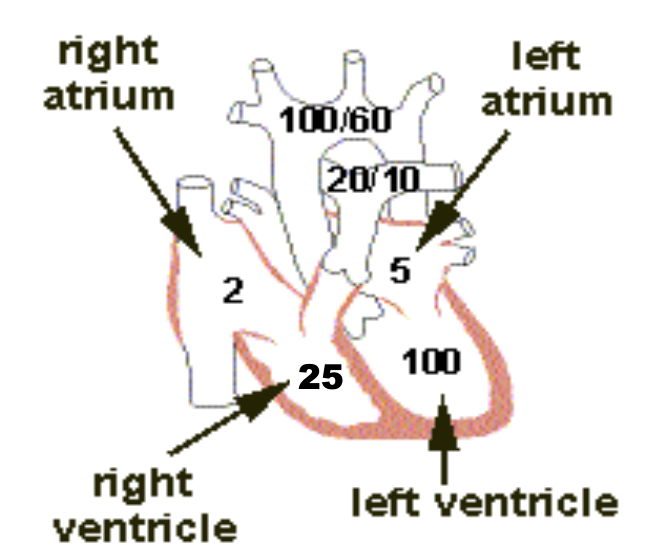
- 肺動脈 (Pulmonary Arteries): 肺動脈の収縮期圧 (Systolic Pressure) は、ほぼ右心室の圧力に等しいです。心収縮期の終わりに肺動脈弁が閉じると、右心室の圧力は急速に低下しますが、肺動脈圧は肺の毛細血管を通じて血液が流れるため、ゆっくりと低下します。
- 平均的な肺動脈収縮期圧 (Systolic Pulmonary Arterial Pressure) は約25 mmHgです。
- 肺動脈拡張期圧 (Diastolic Pulmonary Arterial Pressure) は約8 mmHgです。
- 平均肺動脈圧 (Mean Pulmonary Arterial Pressure) は約15 mmHgです。
肺毛細血管 (Pulmonary Capillaries):
- 平均肺毛細血管圧 (Mean Pulmonary Capillary Pressure): 肺毛細血管内の平均圧は約7 mmHgです。この低い圧力は、ガス交換が効率的に行われるために重要です。
左心房と肺静脈 (Left Atrium and Pulmonary Veins):
- 平均肺静脈および左心房圧 (Mean Pulmonary Venous & Left Atrial Pressure): 仰向けの状態で、平均的な肺静脈圧と左心房圧は約2 mmHg(通常は1 mmHgから5 mmHgの範囲)です。
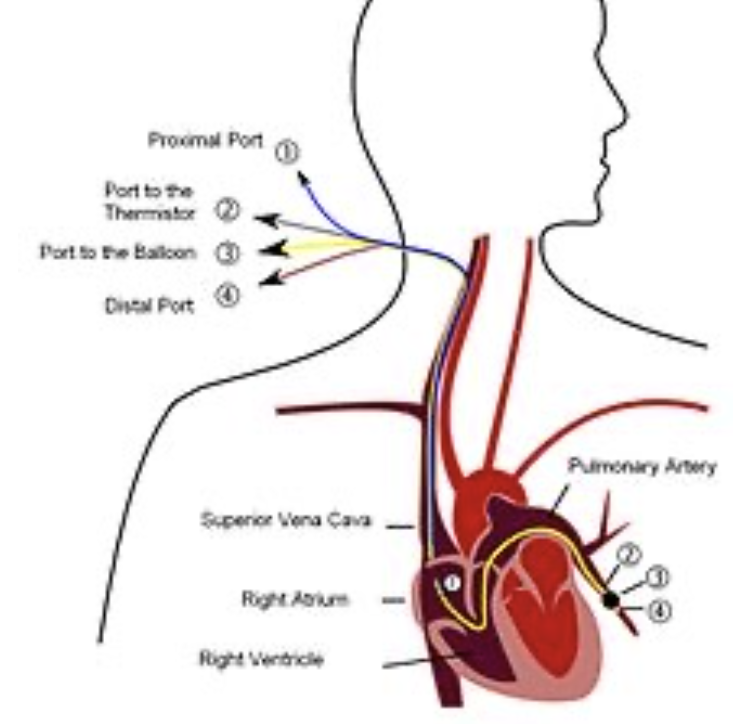
- 肺動脈楔入圧 (Pulmonary Wedge Pressure): この圧力は、左心房圧を推定するために使用されます。通常、楔入圧は約5 mmHgであり、これは左心房圧よりもわずかに高い値です(通常は2~3 mmHg高い)。
- 測定方法: 楔入圧を測定するためには、カテーテルを末梢静脈から右心房へ挿入し、右心系を通って肺動脈の小枝に到達させ、さらに小枝に押し込んでカテーテルをしっかりと楔入させます。
| 部位 | 圧力の種類 | 圧力値 | 説明 |
|---|---|---|---|
| 右心室 (Right Ventricle) | 収縮期圧 (Systolic Pressure) | 約25 mmHg | 右心室から肺動脈への血液供給に必要な圧力。左心室に比べて低い。 |
| 拡張期圧 (Diastolic Pressure) | 約0~1 mmHg | 心室が拡張して血液を受け入れる際の圧力。左心室に比べて低い。 | |
| 肺動脈 (Pulmonary Arteries) | 収縮期圧 (Systolic Pressure) | 約25 mmHg | 右心室の圧力とほぼ等しい。肺動脈弁が閉じた後、圧力はゆっくり低下します。 |
| 拡張期圧 (Diastolic Pressure) | 約8 mmHg | 心収縮期の終わりにおける肺動脈内の圧力。 | |
| 平均肺動脈圧 (Mean Pulmonary Arterial Pressure) | 約15 mmHg | 肺動脈内の平均的な圧力。 | |
| 肺毛細血管 (Pulmonary Capillaries) | 平均肺毛細血管圧 (Mean Pulmonary Capillary Pressure) | 約7 mmHg | 肺毛細血管内の平均圧力。ガス交換が効率的に行われるための低い圧力。 |
| 肺静脈および左心房 (Pulmonary Veins & Left Atrium) | 平均肺静脈および左心房圧 (Mean Pulmonary Venous & Left Atrial Pressure) | 約2 mmHg | 仰向けの状態での平均的な圧力。通常は1 mmHgから5 mmHgの範囲。 |
| 肺動脈楔入圧 (Pulmonary Wedge Pressure) | – | 約5 mmHg | 左心房圧を推定するための圧力。左心房圧よりもわずかに高い値。 |
肺血流 (Pulmonary Blood Flow):
- 血液量: 肺血流は全血液量の約9%を占め、約450 mLの血液が存在します。そのうち約70 mLが肺毛細血管内にあります。残りの血液は、肺動脈と肺静脈に均等に分布しています。
- 心拍出量: 右心室からの心拍出量は左心室からの心拍出量と等しいです。
- 低圧・低抵抗: 肺血流は、低い圧力と抵抗によって特徴づけられます。肺血流は、肺動脈と左心房の間の圧力勾配に直接比例し、肺血管抵抗に反比例します。これを数式で表すと、「Q = ΔP/R」(血流量Qは圧力差ΔPに比例し、抵抗Rに反比例)となります。
肺血流の調節 (Regulation of Pulmonary Blood Flow):
- 調節機構: 肺血流は、主に細動脈の抵抗を変えることで調節されます。この抵抗の変化は、細動脈平滑筋の緊張の変化によって実現されます。
- 局所的な血管作動物質: 血管の緊張は、特に酸素 (O2) を介した局所的な血管作動物質によって媒介されます。
低酸素性血管収縮 (Hypoxic Vasoconstriction):
- PAO2 の役割: 肺胞ガス中の酸素分圧 (Partial Pressure of O2 in Alveolar Gas, PAO2) は、肺血流を調節する主な要因です。低いPAO2は、肺血管収縮を引き起こします。
- 適応機構: これは、酸素供給が不十分な領域への肺血流を減少させる適応機構です。これにより、無駄な血流が抑制されます。
- PAO2 が70 mmHg未満のとき: 低酸素状態では、血管平滑筋細胞が脱分極し、電位依存性カルシウムチャネルが開き、細胞内にカルシウムイオン (Ca2+) が流入して収縮が引き起こされます。また、一酸化窒素合成酵素 (NO Synthase) の抑制も起こります。
PAO2(肺胞酸素分圧)が70 mmHg未満になると、低酸素状態が生じ、肺の血管にいくつかの変化が起こります。これを簡単に説明すると、以下のようなプロセスが関与しています:
- 血管平滑筋細胞の反応:
- 脱分極: 低酸素状態になると、肺の血管を取り巻く平滑筋細胞が脱分極します。これは、細胞の電気的な状態が変化することを意味します。
- カルシウムイオンの流入:
- 脱分極により、電位依存性カルシウムチャネルが開きます。これにより、細胞内にカルシウムイオン(Ca²⁺)が流入します。
- 収縮: 細胞内のカルシウムイオンが増えると、血管の平滑筋が収縮します。これが血管を狭め、血流を制限する原因となります。
- 一酸化窒素合成酵素(NO Synthase)の抑制:
- 通常、一酸化窒素(NO)は血管を拡張させる役割を果たしますが、低酸素状態ではNO Synthase(NOを生成する酵素)が抑制されます。
- これにより、一酸化窒素の生成が減少し、血管の拡張が妨げられます。
このように、PAO2が低下すると、血管が収縮し、血流が調節されるのです。これは酸素供給が不足している部分への血流を減少させ、効率的な酸素の取り込みを助けるための適応機構です。
解剖学の橋渡し:
胎児循環 (Fetal Circulation):
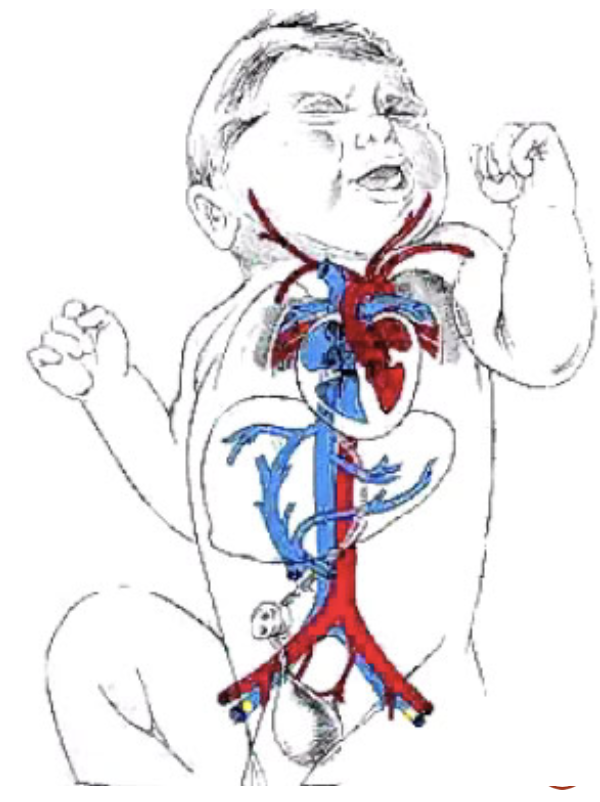
胎児における肺の状態は、全身的な低酸素症の一例です。胎児では、肺胞ガス中の酸素分圧 (PAO2) が母体よりもはるかに低いため、肺の血管収縮が引き起こされます。これにより、肺血管抵抗 (Pulmonary Vascular Resistance) が増加し、肺血流 (Pulmonary Blood Flow) が減少します。胎児の心拍出量の約15%程度しか肺に流れません。
出生時、新生児が最初の呼吸をすると、PAO2は約100 mmHgに上昇します。これにより、低酸素性血管収縮が減少し、肺血管抵抗が低下します。その結果、肺血流が増加し、最終的には成人と同じように左心側の心拍出量に匹敵するようになります。
その他の血管作動物質 (Other Vasoactive Substances):
- トロンボキサンA2 (Thromboxane A2): アラキドン酸代謝(シクロオキシゲナーゼ経路)により、マクロファージ、白血球、血管内皮細胞で生成されます。特定の種類の肺損傷に応答して生成され、動脈と静脈の強力な局所的血管収縮作用を持ちます。
- プロスタサイクリン (Prostacyclin, プロスタグランジンI2): アラキドン酸代謝(シクロオキシゲナーゼ経路)により、肺の血管内皮細胞で生成されます。強力な局所的血管拡張作用を持ちます。
- ロイコトリエン (Leukotrienes): アラキドン酸代謝(リポキシゲナーゼ経路)により生成され、気道収縮を引き起こします。
肺血流の分布 (Distribution of Pulmonary Blood Flow):
- 仰向け (Supine) の場合: 血流は肺全体でほぼ均一に分布します。
- 立位 (Standing) の場合: 重力の影響により血流は不均一に分布します。肺の尖部 (Apex, ゾーン1) では血流が最も少なく、基部 (Base, ゾーン3) では最も多くなります。
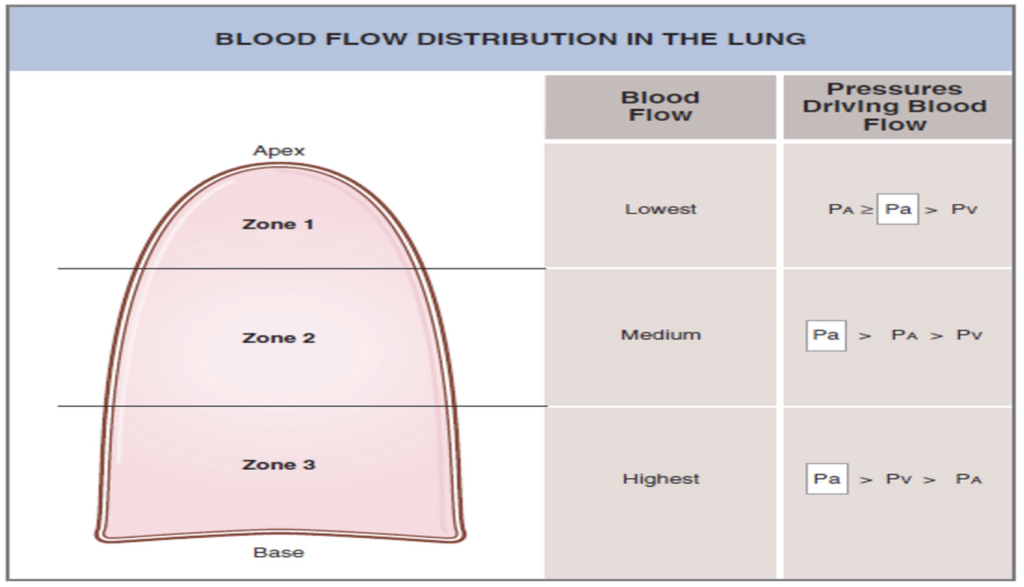
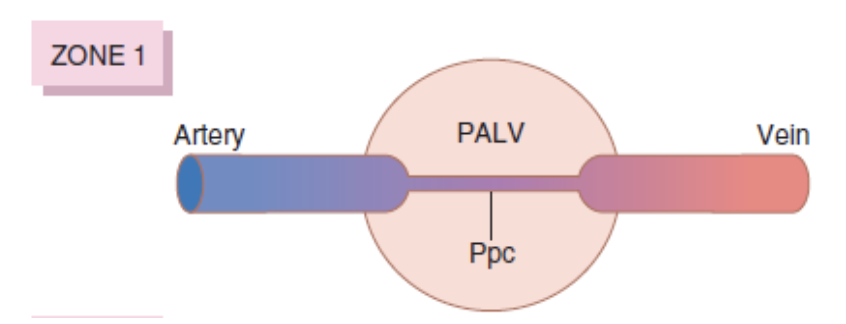
ゾーン1: 血流が最も少ない (Zone 1 – Blood Flow is Lowest)
- 肺胞圧 > 動脈圧 > 静脈圧 (Alveolar Pressure > Arterial Pressure > Venous Pressure)
- 心臓周期の全期間において血流がほとんどない。
- 高い肺胞圧が毛細血管を圧迫し、血流を減少させます。これは、出血や陽圧換気によって肺胞圧が増加した場合に見られます。
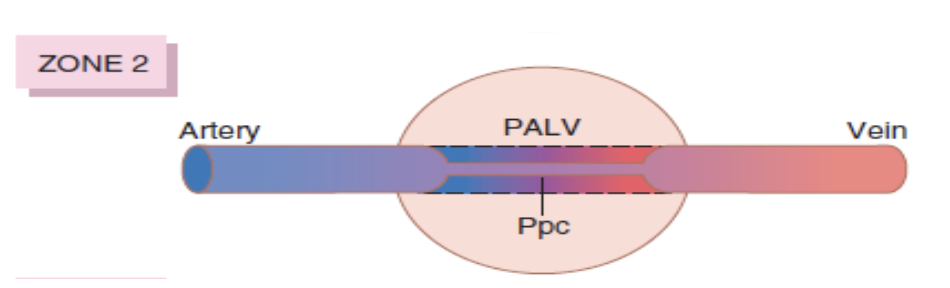
ゾーン2: 血流が中程度 (Zone 2 – Blood Flow is Medium)
- 動脈圧 > 肺胞圧 > 静脈圧 (Arterial Pressure > Alveolar Pressure > Venous Pressure)
- 血流は断続的に発生します。
- 肺の下部に向かって動脈圧が重力の影響で増加するため、動脈圧が肺胞圧を超え、血流は動脈圧と肺胞圧の差によって駆動されます。
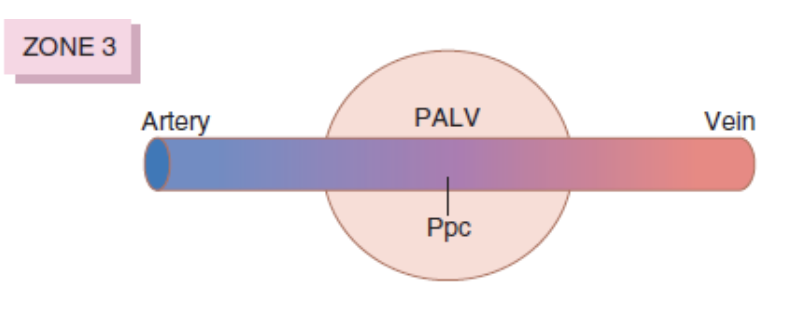
ゾーン3: 血流が最も多い (Zone 3 – Blood Flow is Highest)
- 動脈圧 > 静脈圧 > 肺胞圧 (Arterial Pressure > Venous Pressure > Alveolar Pressure)
- 血流は連続的に発生します。
- 重力の影響で動脈圧が最も高くなり、静脈圧も最終的に肺胞圧を超えるまで増加します。このゾーン3では、血流は動脈圧と静脈圧の差によって駆動されます。これは、他の血管床と同様のメカニズムです。
肺毛細血管の動態 (Pulmonary Capillary Dynamics):
- 肺毛細血管圧 (Pulmonary Capillary Pressure): 肺毛細血管内の圧力は約7 mmHgです。血液が肺毛細血管を通過する時間は約0.8秒ですが、心拍出量が増加すると、この時間は約0.3秒まで短縮されます。このとき、追加の毛細血管が開いて増加した血流を受け入れます。
体液動態 (Fluid Dynamics):
- 肺毛細血管圧: 肺毛細血管圧は約7 mmHgで、末梢組織の機能的な毛細血管圧(約17 mmHg)に比べてかなり低いです。
- 間質液圧 (Interstitial Fluid Pressure): 肺の間質液圧は、末梢皮下組織よりもやや負の値が強く(−5 mmHgから−8 mmHg)、これにより液体の漏出が制御されます。
- 膠質浸透圧 (Colloid Osmotic Pressure): 肺の間質液の膠質浸透圧は約14 mmHgで、末梢組織の値の約半分以下です。
- 肺胞壁: 肺胞壁は非常に薄く、肺胞表面を覆う肺胞上皮は非常に弱いため、間質空間の圧力が肺胞内圧力(0 mmHg)を超えると、肺胞が破れて間質空間から肺胞内に液体が流れ込む可能性があります。

肺毛細血管における液体の移動に関する力
外向きの力(毛細血管から肺間質への液体の移動を引き起こす力):
- 毛細血管圧 (Capillary Pressure): +7 mmHg
- 間質液の膠質浸透圧 (Interstitial Fluid Colloid Osmotic Pressure): +14 mmHg
- 間質液圧 (Negative Interstitial Fluid Pressure): -8 mmHg
- 総外向き力 (Total Outward Force): +29 mmHg
内向きの力(毛細血管内への液体の吸収を引き起こす力):
- 血漿の膠質浸透圧 (Plasma Colloid Osmotic Pressure): -28 mmHg
- 総内向き力 (Total Inward Force): -28 mmHg
平均濾過圧 (Mean Filtration Pressure):
- 計算式: 総外向き力 – 総内向き力
- 平均濾過圧: +29 mmHg – (-28 mmHg) = +1 mmHg
| 項目 | 圧力値 (mmHg) | 説明 |
|---|---|---|
| 外向きの力 (Outward Forces) | 毛細血管から肺間質への液体の移動を引き起こす力 | |
| 毛細血管圧 (Capillary Pressure) | +7 | 血液が肺毛細血管内を通過する際に発生する圧力。毛細血管から液体が間質に押し出される力を示します。 |
| 間質液の膠質浸透圧 (Interstitial Fluid Colloid Osmotic Pressure) | +14 | 肺間質の間質液が浸透圧を通じて液体を引き寄せる力を示します。 |
| 間質液圧 (Negative Interstitial Fluid Pressure) | -8 | 肺間質の液体圧力が負の値で、液体を吸引する力を持つため、液体の移動を助長します。 |
| 総外向き力 (Total Outward Force) | +29 | 上記の外向きの力を合計した圧力。 |
| 内向きの力 (Inward Forces) | 毛細血管内への液体の吸収を引き起こす力 | |
| 血漿の膠質浸透圧 (Plasma Colloid Osmotic Pressure) | -28 | 血漿内の蛋白質が液体を毛細血管内に引き戻す力を示します。 |
| 総内向き力 (Total Inward Force) | -28 | 内向きの力を合計した圧力。 |
| 平均濾過圧 (Mean Filtration Pressure) | +1 | 総外向き力から総内向き力を引いたもの。肺毛細血管における液体の移動を表します。 |
説明:
- 外向きの力は、液体が毛細血管から肺間質に移動するのを促進する力です。
- 内向きの力は、液体が肺間質から毛細血管内に吸収されるのを助ける力です。
- 最終的な平均濾過圧は+1 mmHgで、これは液体がわずかに肺間質に向かって移動することを示しています。このバランスが崩れると、肺水腫などの病的状態が引き起こされる可能性があります。
肺水腫 (Pulmonary Edema):
肺水腫は、肺毛細血管からの液体の濾過が増加するか、肺リンパの機能が阻害され、肺間質液圧が負の範囲から正の範囲に上昇したときに発生します。
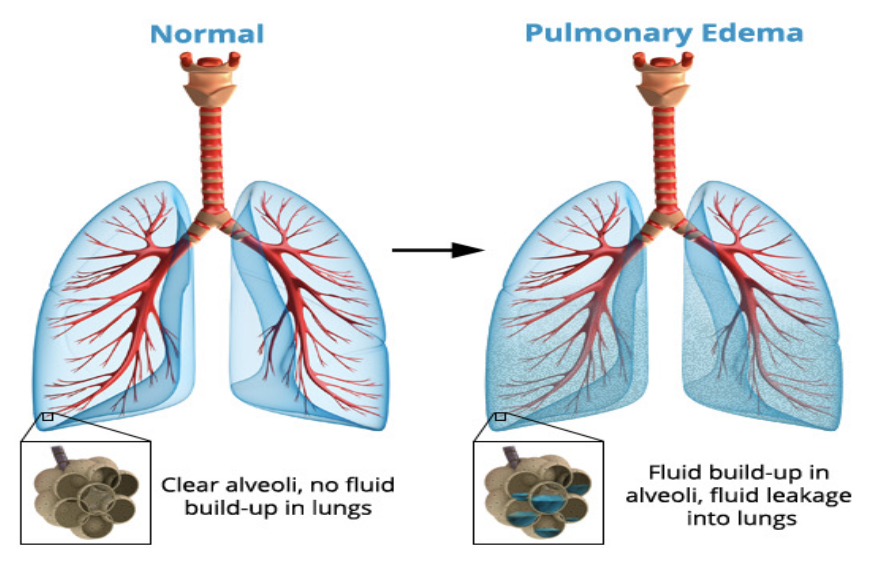
肺水腫の最も一般的な原因:
- 左心不全 (Left-Sided Heart Failure) や僧帽弁疾患 (Mitral Valve Disease)
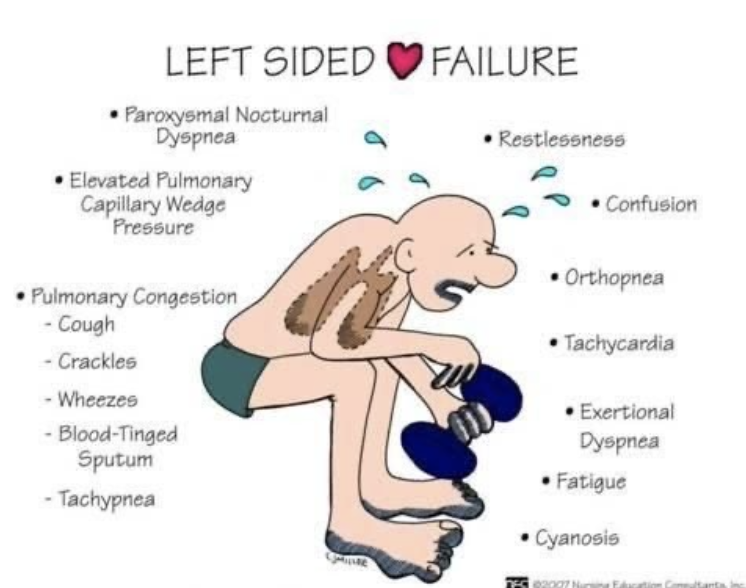
- 感染症 (Infections) や有害物質 (Noxious Substances)
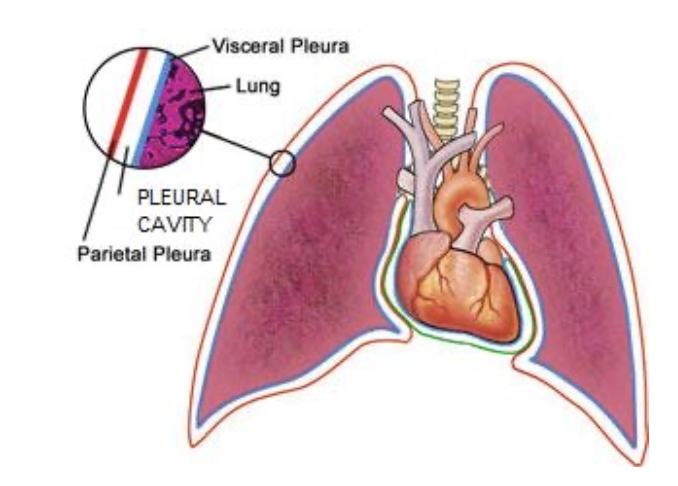
胸膜腔 (The Pleural Cavity):
- 「潜在的な空間」 (Potential Space): 胸膜腔は10~15 ml (0.2 ml/kg) の胸膜液が含まれる空間で、通常の圧力は約-7 mmHgです。
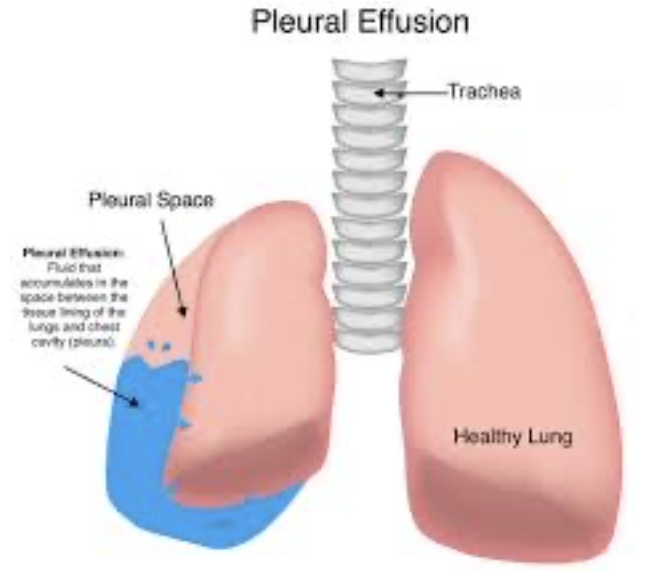
胸水 (Pleural Effusion):
胸水は、胸膜腔に大量の自由な液体が蓄積する状態です。これは「胸膜腔の水腫」とも呼ばれます。胸水の原因は以下の通りです。
- リンパ排出の阻害 (Blockage of Lymphatic Drainage): 胸膜腔からのリンパの排出が阻害されること。
- 心不全 (Cardiac Failure): 心臓の機能不全による液体の胸膜腔への流入。
- 血漿膠質浸透圧の大幅な低下 (Reduced Plasma Colloid Osmotic Pressure): 血漿中の膠質浸透圧が大幅に低下すること。
- 感染症や炎症 (Infections or Inflammation): 感染やその他の原因による炎症。
血漿膠質浸透圧の大幅な低下が原因の場合の機序:
- 血漿膠質浸透圧 (Plasma Colloid Osmotic Pressure):
- 血漿膠質浸透圧は、血漿中のアルブミンなどの蛋白質によって保持される圧力であり、液体を血管内に保持する力です。正常な状態では、膠質浸透圧が血管内に液体を引き戻し、毛細血管からの液体の漏出を防ぎます。
- 血漿膠質浸透圧の低下:
- 低アルブミン血症や肝疾患、栄養失調などにより血漿中の蛋白質濃度が低下すると、血漿膠質浸透圧が低下します。
- これにより、血管内に液体を保持する力が弱まり、液体が血管外に漏れやすくなります。
- 胸膜腔への液体の漏出:
- 血漿膠質浸透圧が低下することで、胸膜の毛細血管から液体が胸膜腔に漏れ出しやすくなり、胸水が発生します。
感染症や炎症が原因の場合の機序:
- 感染症や炎症の影響:
- 肺や胸膜に感染症や炎症が発生すると、局所的な血管透過性が増加します。
- 炎症性サイトカインやプロスタグランジン、ヒスタミンなどが放出されることで、血管の壁が緩み、液体やタンパク質が容易に漏れ出すようになります。
- 胸膜腔への液体の移動:
- 感染や炎症により、毛細血管からの液体の漏出が増加し、胸膜腔に液体が蓄積します。
- さらに、炎症によるリンパ管の機能障害も胸膜腔からの液体の排出を妨げ、胸水が蓄積しやすくなります。
結論:
- 血漿膠質浸透圧の低下は、血管内に液体を保持する力が弱まり、液体が胸膜腔に漏れ出す原因となります。
- 感染症や炎症は、局所的な血管透過性の増加とリンパ管の機能障害により、胸膜腔に液体が蓄積しやすくなります。
これらの機序により、胸水が発生し、胸膜腔に大量の液体が蓄積することになります。
Pulmonary Ventilation
UNIT VII
The main functions of respiration are to provide oxygen to the tissues and remove carbon dioxide. The four major components of respiration are the following: (1) pulmo- nary ventilation, which means the inflow and outflow of air between the atmosphere and the lung alveoli; (2) dif- fusion of oxygen (O2) and carbon dioxide (CO2) between the alveoli and the blood; (3) transport of oxygen and car- bon dioxide in the blood and body fluids to and from the body’s tissue cells; and (4) regulation of ventilation and other facets of respiration. This chapter is a discussion of pulmonary ventilation; the subsequent five chapters cover other respiratory functions plus the physiology of special respiratory abnormalities.
MECHANICS OF PULMONARY VENTILATION
MUSCLES THAT CAUSE LUNG EXPANSION AND CONTRACTION
The lungs can be expanded and contracted in two ways: (1) by downward or upward movement of the diaphragm to lengthen or shorten the chest cavity; and (2) by eleva- tion or depression of the ribs to increase or decrease the anteroposterior diameter of the chest cavity. Figure 38-1 shows these two methods.
Normal quiet breathing is accomplished almost entirely by movement of the diaphragm. During inspi- ration, contraction of the diaphragm pulls the lower surfaces of the lungs downward. Then, during expi- ration, the diaphragm simply relaxes, and the elastic recoil of the lungs, chest wall, and abdominal structures compresses the lungs and expels the air. During heavy breathing, however, the elastic forces are not powerful enough to cause the necessary rapid expiration, so extra force is achieved mainly by contraction of the abdominal muscles, which pushes the abdominal contents upward against the bottom of the diaphragm, thereby compress- ing the lungs.
The second method for expanding the lungs is to raise the rib cage. Raising the rib cage expands the lungs because, in the natural resting position, the ribs slant downward, as shown on the left side of Figure 38-1, thus
allowing the sternum to fall backward toward the verte- bral column. When the rib cage is elevated, however, the ribs project almost directly forward, so the sternum also moves forward, away from the spine, making the antero- posterior thickness of the chest about 20% greater during maximum inspiration than during expiration. Therefore, all the muscles that elevate the chest cage are classified as muscles of inspiration, and the muscles that depress the chest cage are classified as muscles of expiration.
The most important muscles that raise the rib cage are the external intercostals, but others that help are the fol- lowing: (1) sternocleidomastoid muscles, which lift upward on the sternum; (2) anterior serrati, which lift many of the ribs; and (3) scaleni, which lift the first two ribs.
The muscles that pull the rib cage downward during expiration are mainly the following: (1) the abdominal recti, which have the powerful effect of pulling downward on the lower ribs at the same time that they and other abdominal muscles also compress the abdominal con- tents upward against the diaphragm; and (2) the internal intercostals.
Figure 38-1 also shows the mechanism whereby the external and internal intercostals act to cause inspiration and expiration. To the left, the ribs during expiration are angled downward, and the external intercostals are elon- gated forward and downward. As they contract, they pull the upper ribs forward in relation to the lower ribs, which causes leverage on the ribs to raise them upward, thereby causing inspiration. The internal intercostals function in the opposite manner, functioning as expiratory muscles because they angle between the ribs in the opposite direc- tion and cause opposite leverage.
PRESSURES THAT CAUSE MOVEMENT OF AIR IN AND OUT OF THE LUNGS
See Video 38-1. The lung is an elastic structure that col- lapses like a balloon and expels all its air through the tra- chea whenever there is no force to keep it inflated. Also, there are no attachments between the lung and walls of the chest cage, except where it is suspended at its hilum from the mediastinum, the middle section of the chest cavity. Instead, the lung “floats” in the thoracic cavity, surrounded by a thin layer of pleural fluid that lubricates movement of the lungs within the cavity. Furthermore, continual suction of excess fluid into lymphatic channels maintains a slight suction between the visceral surface of the lung pleura and the parietal pleural surface of the tho- racic cavity. Therefore, the lungs are held to the thoracic wall as if glued there, except that they are well lubricated and can slide freely as the chest expands and contracts.

Pleural Pressure and Its Changes During Respira- tion. Pleural pressure is the pressure of the fluid in the thin space between the lung pleura and chest wall pleura. This pressure is normally a slight suction, which means a slightly negative pressure. The normal pleural pressure at the beginning of inspiration is about −5 centimeters of water (cm H2O), which is the amount of suction required to hold the lungs open to their resting level. During nor- mal inspiration, expansion of the chest cage pulls outward on the lungs with greater force and creates more negative pressure to an average of about −7.5 cm H2O.
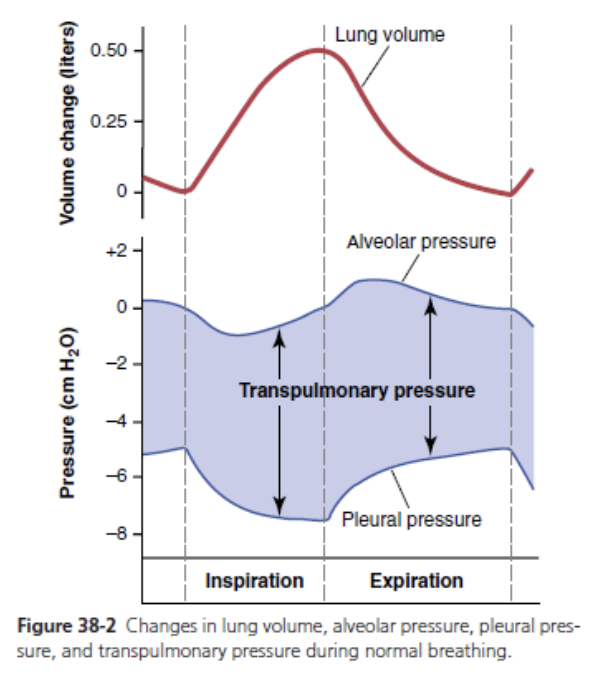
These relationships between pleural pressure and changing lung volume are demonstrated in Figure 38-2; in the lower panel shows the increasing negativity of the pleural pressure from −5 to −7.5 cm H2O during inspira- tion and in the upper panel an increase in lung volume of 0.5 liter. Then, during expiration, the events are essentially reversed.
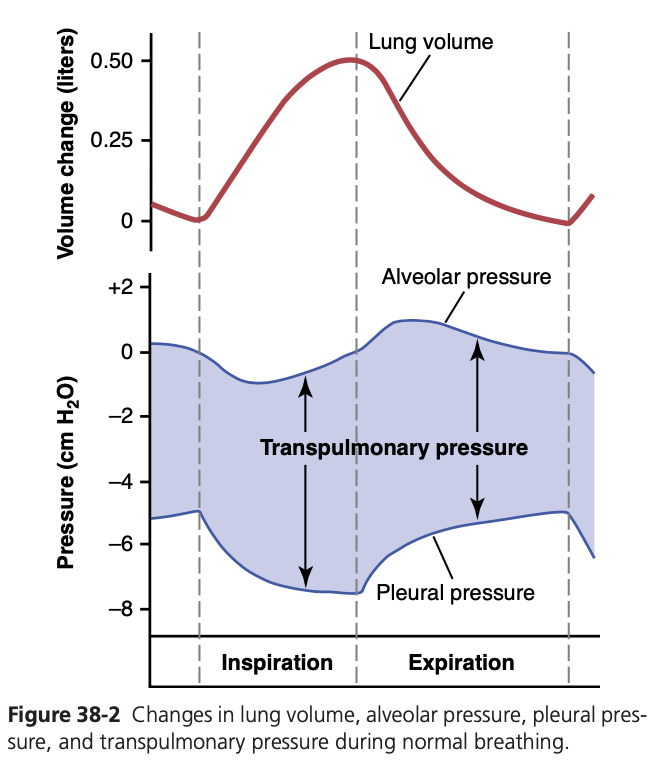
Alveolar Pressure—Air Pressure Inside the Lung Al- veoli. When the glottis is open and no air is flowing into or out of the lungs, the pressures in all parts of the respira- tory tree, all the way to the alveoli, are equal to atmos- pheric pressure, which is considered to be zero reference pressure in the airways—that is, 0 cm H2O pressure. To cause inward flow of air into the alveoli during inspira- tion, the pressure in the alveoli must fall to a value slightly below atmospheric pressure (below 0). The second curve (labeled “alveolar pressure”) of Figure 38-2 demonstrates that during normal inspiration, alveolar pressure decreases to about −1 cm H2O. This slight negative pressure is enough to pull 0.5 liter of air into the lungs in the 2 sec- onds required for normal quiet inspiration.
During expiration, alveolar pressure rises to about +1 cm H2O, which forces the 0.5 liter of inspired air out of the lungs during the 2 to 3 seconds of expiration.
Transpulmonary Pressure—Difference between Al- veolar and Pleural Pressures. Note in Figure 38-2 that the transpulmonary pressure is the pressure difference be- tween that in the alveoli and that on the outer surfaces of the lungs (pleural pressure); it is a measure of the elastic forces in the lungs that tend to collapse the lungs at each instant of respiration, called the recoil pressure.
Compliance of the Lungs
The extent to which the lungs will expand for each unit increase in transpulmonary pressure (if enough time is allowed to reach equilibrium) is called the lung compli- ance. The total compliance of both lungs together in the normal adult averages about 200 ml of air/cm H2O trans- pulmonary pressure. That is, every time the transpulmo- nary pressure increases by 1 cm H2O, the lung volume, after 10 to 20 seconds, will expand 200 ml.
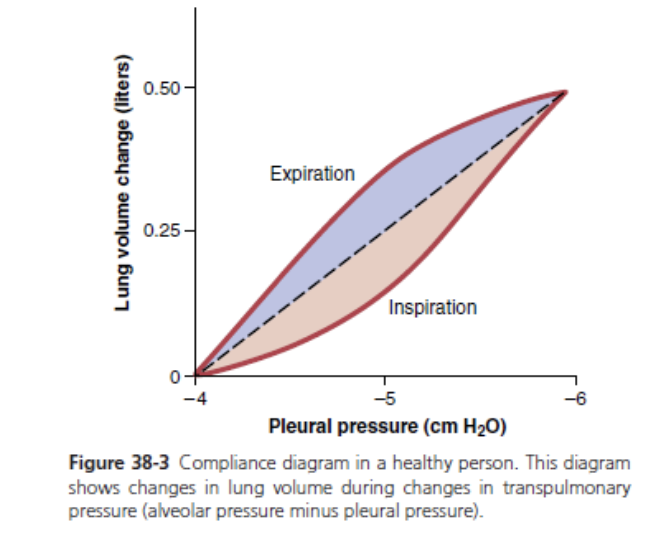
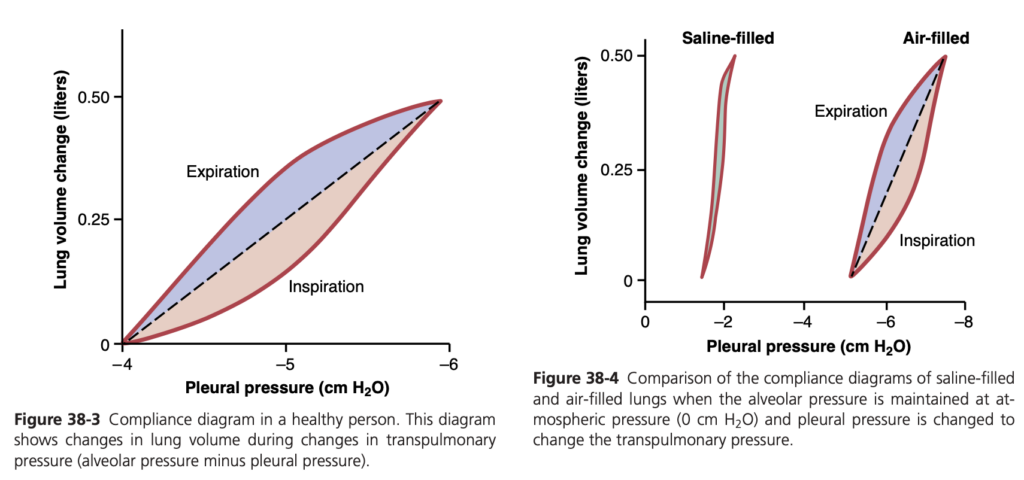
Compliance Diagram of the Lungs. Figure 38-3 is a di- agram relating lung volume changes to changes in pleural pressure, which, in turn, alters transpulmonary pressure. Note that the relationship is different for inspiration and expiration. Each curve is recorded by changing the pleu- ral pressure in small steps and allowing the lung volume to come to a steady level between successive steps. The two curves are called, respectively, the inspiratory com- pliance curve and the expiratory compliance curve, and the entire diagram is called the compliance diagram of the lungs.
The characteristics of the compliance diagram are determined by the elastic forces of the lungs. These forces can be divided into two parts: (1) elastic forces of the lung tissue; and (2) elastic forces caused by surface tension of the fluid that lines the inside walls of the alveoli and other lung air spaces.
The elastic forces of the lung tissue are determined mainly by elastin and collagen fibers interwoven among the lung parenchyma. In deflated lungs, these fibers are in an elastically contracted and kinked state; then, when the lungs expand, the fibers become stretched and unkinked, thereby elongating and exerting even more elastic force.
The elastic forces caused by surface tension are much more complex. The significance of surface tension is shown in Figure 38-4, which compares the compliance diagram of the lungs when filled with saline solution and when filled with air. When the lungs are filled with air, there is an interface between the alveolar fluid and the air in the alveoli. In lungs filled with saline solution, there is no air-fluid interface and, therefore, the surface tension effect is not present; only tissue elastic forces are opera- tive in the lung filled with saline solution.
Note that transpleural pressures required to expand air-filled lungs are about three times as great as those required to expand lungs filled with saline solution. Thus, one can conclude that the tissue elastic forces tending to cause collapse of the air-filled lung represent only about one-third of the total lung elasticity, whereas the fluid-air surface tension forces in the alveoli represent about two- thirds.
The fluid-air surface tension elastic forces of the lungs also increase tremendously when the substance called surfactant is not present in the alveolar fluid.
Surfactant, Surface Tension, and Collapse of the Alveoli
Principle of Surface Tension. When water forms a sur- face with air, the water molecules on the surface of the water have an especially strong attraction for one anoth- er. As a result, the water surface is always attempting to contract. This is what holds raindrops together—a tight contractile membrane of water molecules around the entire surface of the raindrop. Now, let us reverse these principles and see what happens on the inner surfaces of the alveoli. Here, the water surface is also attempting to contract. This tends to force air out of the alveoli through the bronchi and, in doing so, causes the alveoli to try to collapse. The net effect is to cause an elastic contractile force of the entire lungs, which is called the surface ten- sion elastic force.
Surfactant and Its Effect on Surface Tension. Sur- factant is a surface-active agent in water, which means that it greatly reduces the surface tension of water. It is secreted by special surfactant-secreting epithelial cells called type II alveolar epithelial cells, which constitute about 10% of the surface area of the alveoli. These cells are granular, containing lipid inclusions that are secreted in the surfactant into the alveoli.
Surfactant is a complex mixture of several phospholip- ids, proteins, and ions. The most important components are the phospholipid dipalmitoyl phosphatidylcholine, surfactant apoproteins, and calcium ions. The dipalmitoyl phosphatidylcholine and several less important phospho- lipids are responsible for reducing the surface tension. They perform this function by not dissolving uniformly in the fluid lining the alveolar surface. Instead, part of the molecule dissolves while the remainder spreads over the surface of the water in the alveoli. This surface has from one-twelfth to one-half the surface tension of a pure water surface.
Quantitatively, the surface tension of different water fluids is approximately the following: pure water, 72 dynes/cm; normal fluids lining the alveoli but without surfactant, 50 dynes/cm; normal fluids lining the alveoli and with normal amounts of surfactant included, between 5 and 30 dynes/cm.
Pressure in Occluded Alveoli Caused by Surface Ten- sion. If the air passages leading from the alveoli of the lungs are blocked, the surface tension in the alveoli tends to col- lapse the alveoli. This collapse creates positive pressure in the alveoli, attempting to push the air out. The amount of pressure generated in this way in an alveolus can be calcu- lated from the following formula:
Pressure = 2 × Surface tension Radius of alveolus
For the average-sized alveolus with a radius of about 100 micrometers and lined with normal surfactant, this calculates to be about 4 cm H2O pressure (3 mm Hg). If the alveoli were lined with pure water without any surfactant, the pressure would be calculated as about 18 cm H2O pres- sure—4.5 times as great. Thus, one sees the importance of surfactant in reducing alveolar surface tension and there- fore also reducing the effort required by the respiratory muscles to expand the lungs.
Pressure Caused by Surface Tension Is Inversely Related to Alveolar Radius. Note from the preceding formula that the smaller the alveolus, the greater the alveolar pressure caused by the surface tension. Thus, when the alveoli have half the normal radius (50 instead of 100 micrometers), the pressures noted earlier are doubled. This phenomenon is especially significant in small premature infants, many of whom have alveoli with radii less than 25% that of an adult person. Furthermore, surfactant does not normally begin to be secreted into the alveoli until between the sixth and seventh months of gestation and, in some cases, even later. Therefore, many premature infants have little or no sur- factant in the alveoli when they are born, and their lungs have an extreme tendency to collapse, sometimes as much as six to eight times that in a normal adult person. This situ- ation causes respiratory distress syndrome of the newborn. It
is fatal if not treated with strong measures, especially prop- erly applied continuous positive pressure breathing.
EFFECT OF THE THORACIC CAGE ON LUNG EXPANSIBILITY
Thus far, we have discussed the expansibility of the lungs alone, without considering the thoracic cage. The tho- racic cage has its own elastic and viscous characteristics and, even if the lungs were not present in the thorax, muscular effort would still be required to expand the thoracic cage.
Compliance of Thorax and Lungs Together
The compliance of the entire pulmonary system (the lungs and thoracic cage together) is measured while expanding the lungs of a totally relaxed or paralyzed subject. To measure compliance, air is forced into the lungs a little at a time while recording lung pressures and volumes. To inflate this total pulmonary system, almost twice as much pressure is required compared with the same lungs after removal from the chest cage. Therefore, the compliance of the combined lung-thorax system is almost exactly half that of the lungs alone—110 ml/cm H2O pressure for the combined system, compared with 200 ml/cm H2O for the lungs alone. Furthermore, when the lungs are expanded to high volumes or compressed to low volumes, the limitations of the chest become extreme. When near these limits, the compliance of the combined lung-thorax system can be less than 20% of that of the lungs alone.
Work of Breathing
We have already pointed out that during normal quiet breathing, all respiratory muscle contraction occurs during inspiration; expiration is almost entirely a passive process caused by elastic recoil of the lungs and chest cage. Thus, under resting conditions, the respiratory muscles normally perform “work” to cause inspiration but not to cause expi- ration.
The work of inspiration can be divided into three frac- tions: (1) that required to expand the lungs against the lung and chest elastic forces, called compliance work or elastic work; (2) that required to overcome the viscosity of the lung and chest wall structures, called tissue resistance work; and (3) that required to overcome airway resistance to movement of air into the lungs, called airway resistance work.
Energy Required for Respiration. During normal quiet respiration, only 3% to 5% of the total energy expended by the body is required for pulmonary ventilation. However, during heavy exercise, the amount of energy required can increase as much as 50-fold, especially if the person has any degree of increased airway resistance or decreased pulmo- nary compliance. Therefore, one of the major limitations on the intensity of exercise that can be performed is the person’s ability to provide enough muscle energy for the respiratory process alone.
PULMONARY VOLUMES AND CAPACITIES
RECORDING CHANGES IN PULMONARY VOLUME—SPIROMETRY
Pulmonary ventilation can be studied by recording the volume movement of air into and out of the lungs, a method called spirometry. A typical basic spirometer is shown in Figure 38-5. It consists of a drum inverted over a chamber of water, with the drum counterbalanced by a weight. In the drum is a breathing gas, usually air or oxygen; a tube connects the mouth with the gas chamber. When the person breathes into and out of the chamber, the drum rises and falls, and an appropriate recording is made.
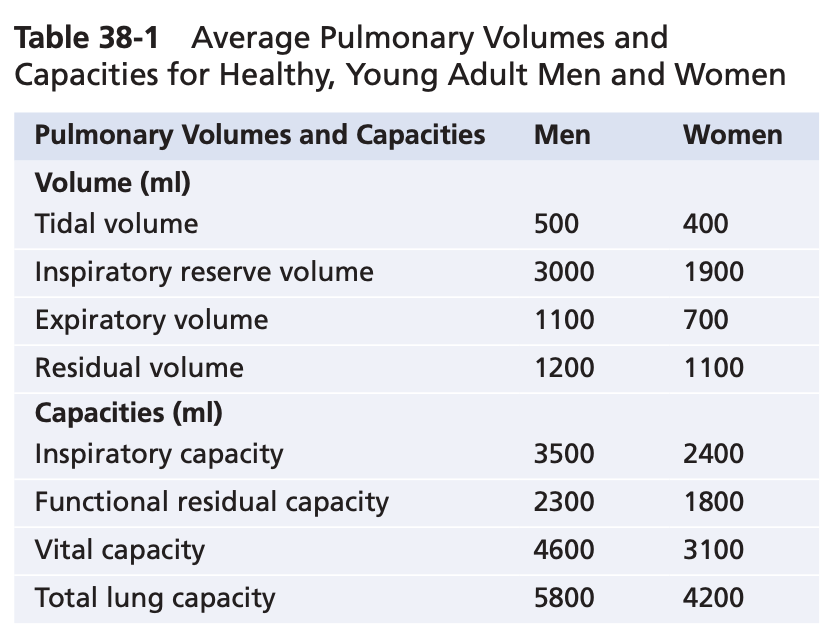
Figure 38-6 shows a spirogram indicating changes in lung volume under different conditions of breathing. For ease in describing the events of pulmonary ventilation, the air in the lungs has been subdivided in this diagram into four volumes and four capacities, which are the aver- ages for a young adult man. Table 38-1 summarizes the average pulmonary volumes and capacities for healthy men and women.

Pulmonary Volumes
Figure 38-6 lists four pulmonary lung volumes that when added together, equal the maximum volume to which the lungs can be expanded. The lung volumes shown are for average adult males, but lung volumes vary considerably depending on physical fitness, age, height, sex, and other factors, such as the altitude at which a person resides. The significance of each of these lung volumes is the following:
1. The tidal volume is the volume of air inspired or ex- pired with each normal breath; it amounts to about 500 ml in the average healthy man.
2. The inspiratory reserve volume is the extra volume of air that can be inspired over and above the nor- mal tidal volume when the person inspires with full force; it is usually equal to about 3000 ml.
3. Theexpiratoryreservevolumeisthemaximumextra volume of air that can be expired by forceful expira- tion after the end of a normal tidal expiration; this volume normally amounts to about 1100 ml in men.
4. The residual volume is the volume of air remaining in the lungs after the most forceful expiration; this volume averages about 1200 ml.
Pulmonary Capacities
In describing events in the pulmonary cycle, it is some- times useful to consider two or more of the volumes together. Such combinations are called pulmonary capac- ities. To the right in Figure 38-6 are listed the important pulmonary capacities, which can be described as follows:
1. The inspiratory capacity equals the tidal volume plus the inspiratory reserve volume. This capacity is the amount of air (≈3500 ml) that a person can breathe in, beginning at the normal expiratory level and distending the lungs to the maximum amount.
2. The functional residual capacity equals the expira- tory reserve volume plus the residual volume. This capacity is the amount of air that remains in the lungs at the end of normal expiration ≈2300 ml).
3. Thevitalcapacityequalstheinspiratoryreservevol- ume plus the tidal volume plus the expiratory re- serve volume. This capacity is the maximum amount of air a person can expel from the lungs after first filling the lungs to their maximum extent and then expiring to the maximum extent (≈4600 ml).
4. The total lung capacity is the maximum volume to which the lungs can be expanded with the greatest possible effort (≈5800 ml); it is equal to the vital ca- pacity plus the residual volume.
Most pulmonary volumes and capacities are usually about 20% to 30% less in women than in men, and they are greater in large and athletic people than in small and asthenic people.
ABBREVIATIONS AND SYMBOLS USED IN PULMONARY FUNCTION STUDIES
Spirometry is only one of many measurement procedures that pulmonary physicians use daily. Many of these pro- cedures depend heavily on mathematical computations. To simplify these calculations, as well as the presentation of pulmonary function data, several abbreviations and symbols have become standardized. The more important of these are given in Table 38-2. Using these symbols, we present here a few simple algebraic equations show- ing some of the interrelationships among the pulmonary volumes and capacities; the student should think through and verify these interrelationships.
VC=IRV+VT +ERV VC = IC + ERV
TLC = VC + RV
TLC = IC + FRC
FRC = ERV + RV
DETERMINATION OF FUNCTIONAL RESIDUAL CAPACITY, RESIDUAL VOLUME, AND TOTAL LUNG CAPACITY—HELIUM DILUTION METHOD
The functional residual capacity (FRC), which is the vol- ume of air that remains in the lungs at the end of each normal expiration, is important to lung function. Because its value changes markedly in some types of pulmonary disease, it is often desirable to measure this capacity. The spirometer cannot be used in to measure the FRC directly because the air in the residual volume of the lungs cannot be expired into the spirometer, and this volume consti- tutes about half of the FRC. To measure FRC, the spirom- eter must be used in an indirect manner, usually by means of a helium dilution method, as follows.
A spirometer of known volume is filled with air mixed with helium at a known concentration. Before breathing from the spirometer, the person expires nor- mally. At the end of this expiration, the remaining vol- ume in the lungs is equal to the FRC. At this point, the subject immediately begins to breathe from the spirom- eter, and the gases of the spirometer mix with the gases of the lungs. As a result, the helium becomes diluted by the FRC gases, and the volume of the FRC can be calcu- lated from the degree of dilution of the helium, using the following formula:
FRC=(CiHe −1)ViSpir CfHe
where FRC is functional residual capacity, CiHe is the initial concentration of helium in the spirometer, CfHe is the final concentration of helium in the spirometer, and ViSpir is the initial volume of the spirometer.
Once the FRC has been determined, the residual vol- ume (RV) can be determined by subtracting expiratory reserve volume (ERV), as measured by normal spirom- etry, from the FRC. Also, the total lung capacity (TLC) can be determined by adding the inspiratory capacity (IC) to the FRC. That is:
MINUTE RESPIRATORY VOLUME EQUALS RESPIRATORY RATE TIMES TIDAL VOLUME
The minute respiratory volume is the total amount of new air moved into the respiratory passages each min- ute and is equal to the tidal volume times the respiratory rate per minute. The normal tidal volume is about 500 ml, and the normal respiratory rate is about 12 breaths/ min. Therefore, the minute respiratory volume averages about 6 L/min. A person can live for a short period with a minute respiratory volume as low as 1.5 L/min and a respiratory rate of only 2 to 4 breaths/min.
The respiratory rate occasionally rises to 40 to 50 breaths/min, and the tidal volume can become as great as the vital capacity, about 4600 ml in a young man. This can give a minute respiratory volume greater than 200 L/min, or more than 30 times normal. Most people cannot sus- tain more than half to two-thirds of these values for longer than 1 minute.
ALVEOLAR VENTILATION
The ultimate importance of pulmonary ventilation is to renew the air in the gas exchange areas of the lungs con- tinually, where air is in proximity to the pulmonary blood. These areas include the alveoli, alveolar sacs, alveolar ducts, and respiratory bronchioles. The rate at which new air reaches these areas is called alveolar ventilation.
DEAD SPACE AND ITS EFFECT ON ALVEOLAR VENTILATION
Some of the air a person breathes never reaches the gas exchange areas but simply fills respiratory passages, such as the nose, pharynx, and trachea, where gas exchange does not occur. This air is called dead space air because it is not useful for gas exchange.
On expiration, the air in the dead space is expired first, before any of the air from the alveoli reaches the atmo- sphere. Therefore, the dead space is very disadvantageous for removing the expiratory gases from the lungs.
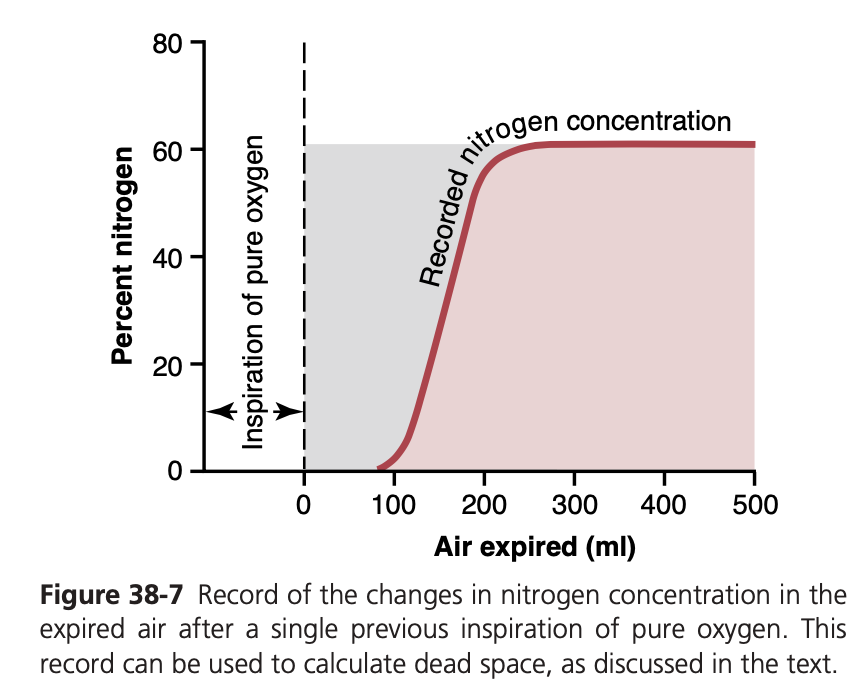
Measurement of Dead Space Volume. A simple method for measuring dead space volume is demonstrated by the graph in Figure 38-7. In making this measurement, the sub- ject suddenly takes a deep breath of 100% O2, which fills the entire dead space with pure O2. Some oxygen also mixes with the alveolar air but does not completely replace this air. Then the person expires through a rapidly recording nitrogen meter, which makes the record shown in the figure. The first portion of the expired air comes from the dead space regions of the respiratory passageways, where the air has been completely re- placed by O2. Therefore, in the early part of the record, only O2 appears, and the nitrogen concentration is 0. Then, when al- veolar air begins to reach the nitrogen meter, the nitrogen con- centration rises rapidly because alveolar air containing large amounts of nitrogen begins to mix with the dead space air. After still more air has been expired, all the dead space air has been washed from the passages and only alveolar air remains. Therefore, the recorded nitrogen concentration reaches a pla- teau level equal to its concentration in the alveoli, as shown at the right in the figure. The gray area represents the air that has no nitrogen in it and is a measure of the volume of dead space air. For exact quantification, the following equation is used:
VD = Gray area × VE Pink area + Gray area
where VD is dead space air and VE is the total volume of expired air.
Let us assume, for example, that the gray area on the graph is 30 square centimeters, the pink area is 70 square centimeters, and the total volume expired is 500 ml. The dead space would be
30 ×500=150 ml 30+70
Normal Dead Space Volume. The normal dead space air in a young man is about 150 ml. Dead space air increases slightly with age.
Anatomical Versus Physiological Dead Space. The method just described for measuring the dead space meas- ures the volume of all the space of the respiratory system other than the alveoli and their other closely related gas ex- change areas; this space is called the anatomic dead space. On occasion, some of the alveoli are nonfunctional or only partially functional because of absent or poor blood flow through the adjacent pulmonary capillaries. Therefore, these alveoli must also be considered dead space. When the alveolar dead space is included in the total measurement of dead space, this is called the physiological dead space, in contradistinction to the anatomical dead space. In a person with healthy lungs, the anatomical and physiological dead spaces are nearly equal because all alveoli are functional in the normal lung but, in a person with partially functional or nonfunctional alveoli in some parts of the lungs, the physiological dead space may be as much as 10 times the volume of the anatomical dead space, or 1 to 2 liters. These problems are discussed further in Chapter 40 in relation to pulmonary gaseous exchange and in Chapter 43 in relation to certain pulmonary diseases.
RATE OF ALVEOLAR VENTILATION
Alveolar ventilation per minute is the total volume of new air entering the alveoli and adjacent gas exchange areas each minute. It is equal to the respiratory rate times the amount of new air that enters these areas with each breath VA =Freq× (VT −VD)
is the volume of alveolar ventilation per min-
Conchae
Glottis
Larynx, vocal cords
Trachea
O2 Pharynx CO2
ute, Freq is the frequency of respiration per minute, Vt is the tidal volume, and Vd is the physiological dead space volume.
Thus, with a normal tidal volume of 500 ml, a normal dead space of 150 ml, and a respiratory rate of 12 breaths/ min, alveolar ventilation equals 12 × (500 − 150), or 4200 ml/min.
Alveolar ventilation is one of the major factors deter- mining the concentrations of oxygen and carbon dioxide in the alveoli. Therefore, almost all discussions of gaseous exchange in the following chapters on the respiratory sys- tem focus on alveolar ventilation.
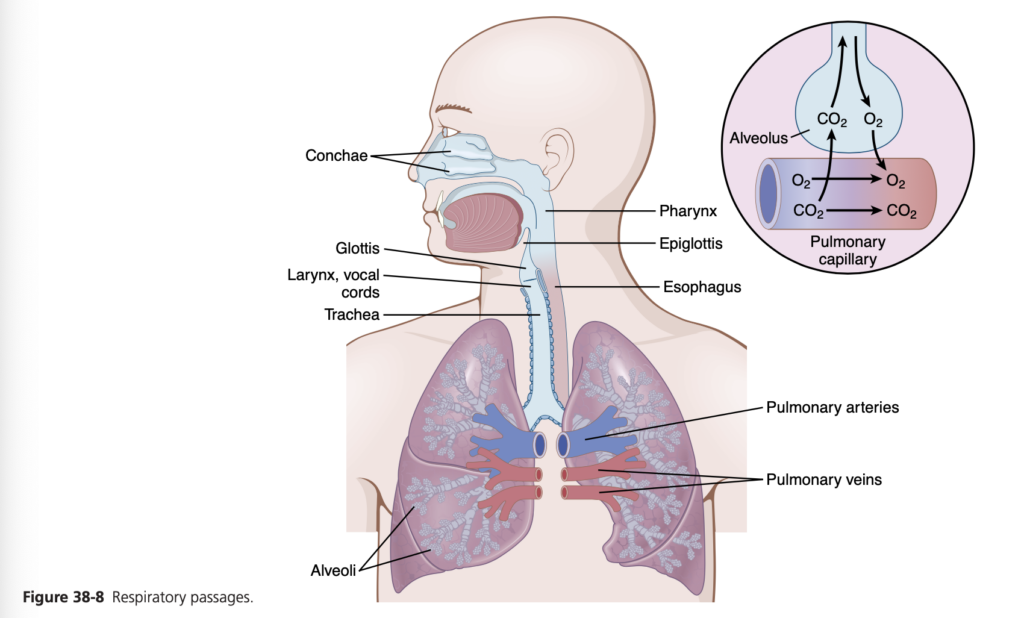
Functions of Respiratory Passageways
Trachea, Bronchi, and Bronchioles
Figure 38-8 highlights the respiratory passageways. The air is distributed to the lungs by way of the trachea, bronchi, and bronchioles.
One of the most important challenges in the respiratory passageways is to keep them open and allow easy passage of air to and from the alveoli. To keep the trachea from col- lapsing, multiple cartilage rings extend about five-sixths of the way around the trachea. In the walls of the bronchi, less extensive curved cartilage plates also maintain a reasonable amount of rigidity yet allow sufficient motion for the lungs to expand and contract. These plates become progressively less extensive in the later generations of bronchi and are gone in the bronchioles, which usually have diameters less than 1.5 millimeters. The bronchioles are not prevented from collapsing by the rigidity of their walls. Instead, they are kept expanded mainly by the same transpulmonary pressures that expand the alveoli. That is, as the alveoli en- large, the bronchioles also enlarge, but not as much.
Muscular Wall of the Bronchi and Bronchioles. In all areas of the trachea and bronchi not occupied by cartilage plates, the walls are composed mainly of smooth mus- cle. Also, the walls of the bronchioles are almost entirely smooth muscle, with the exception of the most terminal bronchiole, called the respiratory bronchiole, which is mainly pulmonary epithelium and underlying fibrous tissue plus a few smooth muscle fibers. Many obstructive diseases of the lung result from narrowing of the smaller bronchi and larger bronchioles, often because of excessive contrac- tion of the smooth muscle.
Resistance to Airflow in the Bronchial Tree. Under nor- mal respiratory conditions, air flows through the respira- tory passageways so easily that less than 1 cm H2O pressure gradient from the alveoli to the atmosphere is sufficient to cause enough airflow for quiet breathing. The greatest amount of resistance to airflow occurs not in the tiny air passages of the terminal bronchioles but in some of the larger bronchioles and bronchi near the trachea. The rea- son for this high resistance is that there are relatively few of these larger bronchi in comparison with the approximately 65,000 parallel terminal bronchioles, through each of which only a minute amount of air must pass.
In some disease conditions, the smaller bronchioles play a far greater role in determining airflow resistance because of their small size and because they are easily occluded by the following: (1) muscle contraction in their walls; (2) edema in the walls; or (3) mucus collecting in the lumens of the bronchioles.
Nervous and Local Control of the Bronchiolar Muscu- lature—Sympathetic Dilation of the Bronchioles. Direct control of the bronchioles by sympathetic nerve fibers is relatively weak because few of these fibers penetrate to the central portions of the lung. However, the bronchial tree is very much exposed to norepinephrine and epinephrine released into the blood by sympathetic stimulation of the adrenal gland medullae. Both these hormones, especially epinephrine because of its greater stimulation of beta- adrenergic receptors, cause dilation of the bronchial tree.
Parasympathetic Constriction of the Bronchioles.
A few parasympathetic nerve fibers derived from the va- gus nerves penetrate the lung parenchyma. These nerves secrete acetylcholine and, when activated, cause mild to moderate constriction of the bronchioles. When a disease process such as asthma has already caused some bronchi- olar constriction, superimposed parasympathetic nervous stimulation often worsens the condition. When this situa- tion occurs, administration of drugs that block the effects of acetylcholine, such as atropine, can sometimes relax the respiratory passages enough to relieve the obstruction.
Sometimes the parasympathetic nerves are also acti- vated by reflexes that originate in the lungs. Most of these reflexes begin with irritation of the epithelial membrane of the respiratory passageways, initiated by noxious gases, dust, cigarette smoke, or bronchial infection. Also, a bron- chiolar constrictor reflex often occurs when microemboli occlude small pulmonary arteries.
Local Secretory Factors May Cause Bronchiolar Constric- tion. Several substances formed in the lungs are often active in causing bronchiolar constriction. Two of the most impor- tant of these are histamine and slow reactive substance of anaphylaxis. Both these substances are released in the lung tissues by mast cells during allergic reactions, especially those caused by pollen in the air. Therefore, they play key roles in causing airway obstruction in allergic asthma; this is especially true of the slow reactive substance of anaphylaxis.
The same irritants that cause parasympathetic constric- tor reflexes of the airways—smoke, dust, sulfur dioxide, and some of the acidic elements in smog—may also act directly on the lung tissues to initiate local, non-nervous reactions that cause obstructive constriction of the airways.
Mucus Lining the Respiratory Passageways and Cilia Action to Clear the Passageways
All the respiratory passages, from the nose to the terminal bronchioles, are kept moist by a layer of mucus that coats the entire surface. The mucus is secreted partly by individual mucous goblet cells in the epithelial lining of the passages and partly by small submucosal glands. In addition to keeping the surfaces moist, the mucus traps small particles out of the in- spired air and keeps most of these particles from ever reach- ing the alveoli. The mucus is removed from the passages in the following manner.
The entire surface of the respiratory passages, in the nose and the lower passages, down as far as the terminal bronchi- oles, is lined with ciliated epithelium, with about 200 cilia on each epithelial cell. These cilia beat continually at a rate of 10 to 20 times/sec by the mechanism explained in Chapter 2, and the direction of their “power stroke” is always toward the phar- ynx. That is, the cilia in the lungs beat upward, whereas those in the nose beat downward. This continual beating causes the coat of mucus to flow slowly, at a velocity of a few millime- ters per minute, toward the pharynx. Then the mucus and its entrapped particles are swallowed or coughed to the exterior.
Cough Reflex
The bronchi and trachea are so sensitive to light touch that slight amounts of foreign matter or other causes of irritation initiate the cough reflex. The larynx and carina (the point where the trachea divides into the bronchi) are especially sensitive, and the terminal bronchioles and even the alveoli are sensitive to corrosive chemical stimuli such as sulfur dioxide gas or chlorine gas. Afferent nerve impulses pass from the respiratory passages mainly through the vagus nerves to the medulla of the brain. There, an automatic sequence of events is triggered by the neu- ronal circuits of the medulla, causing the following effects.
1. Up to 2.5 liters of air are rapidly inspired.
2. The epiglottis closes, and the vocal cords shut tightly to
entrap the air within the lungs.
3. The abdominal muscles contract forcefully, pushing
against the diaphragm while other expiratory muscles, such as the internal intercostals, also contract forcefully. Consequently, the pressure in the lungs rises rapidly, to as much as 100 mm Hg or more.
4. The vocal cords and epiglottis suddenly open widely, so that air under this high pressure in the lungs explodes outward. Sometimes this air is expelled at velocities ranging from 75 to 100 miles/hour.
Importantly, the strong compression of the lungs col- lapses the bronchi and trachea by causing their noncarti- laginous parts to invaginate inward, so the exploding air actually passes through bronchial and tracheal slits. The rapidly moving air usually carries with it any foreign matter that is present in the bronchi or trachea.
Sneeze Reflex
The sneeze reflex is very much like the cough reflex, except that it applies to the nasal passageways instead of the lower respiratory passages. The initiating stimulus of the sneeze reflex is irritation in the nasal passageways; the afferent im- pulses pass in the fifth cranial nerve to the medulla, where the reflex is triggered. A series of reactions similar to those for the cough reflex takes place, but the uvula is depressed, so large amounts of air pass rapidly through the nose, thus helping clear the nasal passages of foreign matter.
Normal Respiratory Functions of the Nose
As air passes through the nose, three distinct normal respira- tory functions are performed by the nasal cavities: (1) the air is warmed by the extensive surfaces of the conchae and sep- tum, a total area of about 160 square centimeters (see Figure 38-8); (2) the air is almost completely humidified, even before it passes beyond the nose; and (3) the air is partially filtered. These functions together are called the air-conditioning func- tion of the upper respiratory passageways. Ordinarily, the temperature of the inspired air rises to within 1°F of body tem- perature and to within 2% to 3% of full saturation with water vapor before it reaches the trachea. When a person breathes air through a tube directly into the trachea (as through a tra- cheostomy), the cooling and especially the drying effect in the lower lung can lead to serious lung crusting and infection.
Filtration Function of the Nose. The hairs at the entrance to the nostrils are important for filtering out large particles. Much more important, though, is the removal of particles by turbulent precipitation. That is, the air passing through the nasal passageways hits many obstructing vanes—the con- chae (also called turbinates, because they cause turbulence of the air), the septum, and the pharyngeal wall. Each time air hits one of these obstructions, it must change its direc- tion of movement. The particles suspended in the air, having far more mass and momentum than air, cannot change their direction of travel as rapidly as the air can. Therefore, they continue forward, striking the surfaces of the obstructions, and are entrapped in the mucous coating and transported by the cilia to the pharynx to be swallowed.
Size of Particles Entrapped in the Respiratory Passag- es. The nasal turbulence mechanism for removing particles from air is so effective that almost no particles larger than 6 micrometers in diameter enter the lungs through the nose. This size is smaller than red blood cells.
Of the remaining particles, many that are between 1 and 5 micrometers settle in the smaller bronchioles as a result of gravitational precipitation. For example, terminal bron- chiolar disease is common in coal miners because of settled dust particles. Some of the still smaller particles (<1 mi- crometer in diameter) diffuse against the walls of the alveoli and adhere to the alveolar fluid. However, many particles smaller than 0.5 micrometer in diameter remain suspend- ed in the alveolar air and are expelled by expiration. For
example, the particles of cigarette smoke are about 0.3 mi- crometer. Almost none of these particles are precipitated in the respiratory passageways before they reach the alveoli. Unfortunately, up to one-third of them do precipitate in the alveoli by the diffusion process, with the balance remaining suspended and expelled in the expired air.
Many of the particles that become entrapped in the al- veoli are removed by alveolar macrophages, as explained in Chapter 34, and others are carried away by the lung lym- phatics. An excess of particles can cause growth of fibrous tissue in the alveolar septa, leading to permanent debility.
Vocalization
Speech involves not only the respiratory system but also the following: (1) specific speech nervous control centers in the cerebral cortex, discussed in Chapter 58; (2) respiratory control centers of the brain; and (3) the articulation and resonance structures of mouth and nasal cavities. Speech is composed of two mechanical functions: (1) phonation, which is achieved by the larynx; and (2) articulation, which is achieved by the structures of the mouth.
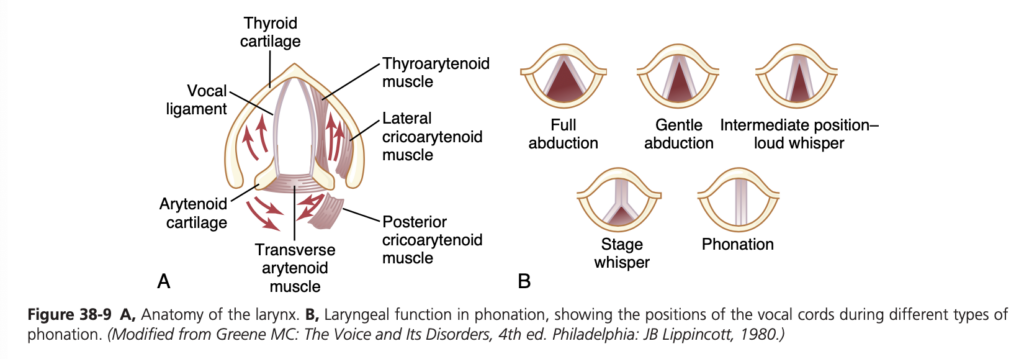
Phonation. The larynx, shown in Figure 38-9A, is es- pecially adapted to act as a vibrator. The vibrating elements are the vocal folds, commonly called the vocal cords. The vocal cords protrude from the lateral walls of the larynx toward the center of the glottis; they are stretched and po- sitioned by several specific muscles of the larynx itself.
Figure 38-9B shows the vocal cords as they are seen when looking into the glottis with a laryngoscope. During normal breathing, the cords are wide open to allow easy pas- sage of air. During phonation, the cords move together so that passage of air between them will cause vibration. The pitch of the vibration is determined mainly by the degree of stretch of the cords, but also by how tightly the cords are approximated to one another and by the mass of their edges.
Figure 38-9A shows a dissected view of the vocal folds after removal of the mucous epithelial lining. Immediately in- side each cord is a strong elastic ligament called the vocal liga- ment. This ligament is attached anteriorly to the large thyroid cartilage, which is the cartilage that projects forward from the anterior surface of the neck and is called the Adam’s apple. Posteriorly, the vocal ligament is attached to the vocal pro- cesses of two arytenoid cartilages. The thyroid cartilage and the arytenoid cartilages articulate from below with another cartilage (not shown in Figure 38-9), the cricoid cartilage.
The vocal cords can be stretched by forward rotation of the thyroid cartilage or posterior rotation of the arytenoid cartilages, activated by muscles stretching from the thyroid cartilage and arytenoid cartilages to the cricoid cartilage. Muscles located in the vocal cords lateral to the vocal liga- ments, the thyroarytenoid muscles, can pull the arytenoid cartilages toward the thyroid cartilage and, therefore, loos- en the vocal cords. Also, slips of these muscles in the vocal cords can change the shapes and masses of the vocal cord edges, sharpening them to emit high-pitched sounds and blunting them for the more bass sounds.
Several other sets of small laryngeal muscles lie between the arytenoid cartilages and cricoid cartilage and can ro- tate these cartilages inward or outward or pull their bases together or apart to give the various configurations of the vocal cords, shown in Figure 38-9B.
Articulation and Resonance. The three major organs of articulation are the lips, tongue, and soft palate. They need not be discussed in detail here because we are all familiar with their movements during speech and other vocaliza- tions.
The resonators include the mouth, the nose and associ- ated nasal sinuses, the pharynx, and even the chest cavity. Again, we are familiar with the resonating qualities of these structures. For example, the function of the nasal resona- tors is demonstrated by the change in voice quality when a person has a severe cold that blocks the air passages to these resonators.
Pulmonary Circulation, Pulmonary Edema, and Pleural Fluid
The lung has two circulations, a high-pressure, low-flow circulation and a low-pressure, high-flow circulation. The high-pressure, low-flow circulation supplies systemic arte- rial blood to the trachea, bronchial tree (including the terminal bronchioles), supporting tissues of the lung, and outer coats (adventitia) of the pulmonary arteries and veins. The bronchial arteries, which are branches of the thoracic aorta, supply most of this systemic arterial blood at a pressure that is only slightly lower than the aortic pressure.
The low-pressure, high-flow circulation supplies venous blood from all parts of the body to the alveolar capillar- ies where oxygen (O2) is added and carbon dioxide (CO2) is removed. The pulmonary artery, which receives blood from the right ventricle, and its arterial branches carry blood to the alveolar capillaries for gas exchange, and the pulmonary veins then return the blood to the left atrium to be pumped by the left ventricle though the systemic circulation.
In this chapter, we discuss the special aspects of the pulmonary circulation that are important for gas exchange in the lungs.
PHYSIOLOGICAL ANATOMY OF THE PULMONARY CIRCULATORY SYSTEM
Pulmonary Vessels. The pulmonary artery extends only 5 centimeters beyond the apex of the right ventricle and then divides into right and left main branches that supply blood to the two respective lungs.
The pulmonary artery has a wall thickness one-third that of the aorta. The pulmonary arterial branches are short, and all the pulmonary arteries, even the smaller arteries and arterioles, have larger diameters than their counterpart systemic arteries. This feature, combined with the fact that the vessels are thin and distensible, gives the pulmonary arterial tree a large compliance, averaging almost 7 ml/mm Hg, which is similar to that of the entire systemic arterial tree. This large compliance allows the pulmonary arteries to accommodate the stroke volume output of the right ventricle.
The pulmonary veins, like the pulmonary arteries, are also short. They immediately empty their effluent blood into the left atrium.
Bronchial Vessels. Blood also flows to the lungs through small bronchial arteries that originate from the systemic circulation, amounting to 1% to 2% of the total cardiac output. This bronchial arterial blood is oxygenated blood, in contrast to the partially deoxygenated blood in the pul- monary arteries. It supplies the supporting tissues of the lungs, including the connective tissue, septa, and large and small bronchi. After this bronchial and arterial blood passes through the supporting tissues, it empties into the pulmonary veins and enters the left atrium, rather than passing back to the right atrium. Therefore, the flow into the left atrium and left ventricular output are about 1% to 2% greater than that of the right ventricular output.
Lymphatics. Lymph vessels are present in all the support- ive tissues of the lung, beginning in the connective tissue spaces that surround the terminal bronchioles, coursing to the hilum of the lung, and then mainly into the right thoracic lymph duct. Particulate matter entering the alve- oli is partly removed by these lymph vessels, and plasma protein leaking from the lung capillaries is also removed from the lung tissues, thereby helping to prevent pulmo- nary edema.
PRESSURES IN THE PULMONARY SYSTEM
Pressures in the Right Ventricle. The pressure pulse curves of the right ventricle and pulmonary artery are shown in the lower portion of Figure 39-1. These curves are contrasted with the much higher aortic pressure curve shown in the upper portion of the figure. The normal sys- tolic pressure in the right ventricle averages about 25 mm Hg, and the diastolic pressure averages about 0 to 1 mm Hg, values that are only one-fifth those for the left ventricle.
Pressures in the Pulmonary Artery. During systole, the pressure in the pulmonary artery is essentially equal to the pressure in the right ventricle, as also shown in Figure 39-1. However, after the pulmonary valve closes at the end of systole, the ventricular pressure falls pre- cipitously, whereas the pulmonary arterial pressure falls more slowly as blood flows through the lungs.
As shown in Figure 39-2, the systolic pulmonary arte- rial pressure normally averages about 25 mm Hg in the human being, the diastolic pulmonary arterial pressure is about 8 mm Hg, and the mean pulmonary arterial pres- sure is 15 mm Hg.
Pulmonary Capillary Pressure. The mean pulmonary capillary pressure, as diagrammed in Figure 39-2, is about 7 mm Hg. The importance of this low capillary pressure is discussed in detail later in the chapter in relation to fluid exchange functions of the pulmonary capillaries.
Left Atrial and Pulmonary Venous Pressures. The mean pressure in the left atrium and major pulmonary veins averages about 2 mm Hg in the recumbent person, varying from as low as 1 mm Hg to as high as 5 mm Hg. It usually is not feasible to measure someone’s left atrial pressure using a direct measuring device because it is difficult to pass a catheter through the heart chambers into the left atrium. However, the left atrial pressure can be estimated with moderate accuracy by measuring the so-called pulmonary wedge pressure. This is measured by inserting a catheter first through a peripheral vein to the right atrium, then through the right side of the heart and through the pulmonary artery into one of the small branches of the pulmonary artery, and finally pushing the catheter until it wedges tightly in the small branch.
The pressure measured through the catheter, called the “wedge pressure,” is about 5 mm Hg. Because all blood flow has been stopped in the small wedged artery, and because the blood vessels extending beyond this artery make a direct connection with the pulmonary capillaries, this wedge pressure is usually only 2 to 3 mm Hg higher than the left atrial pressure. When the left atrial pressure rises to high values, the pulmonary wedge pressure also rises. Therefore, wedge pressure measurements can be used to estimate changes in pulmonary capillary pressure and left atrial pressure in patients with congestive heart failure.
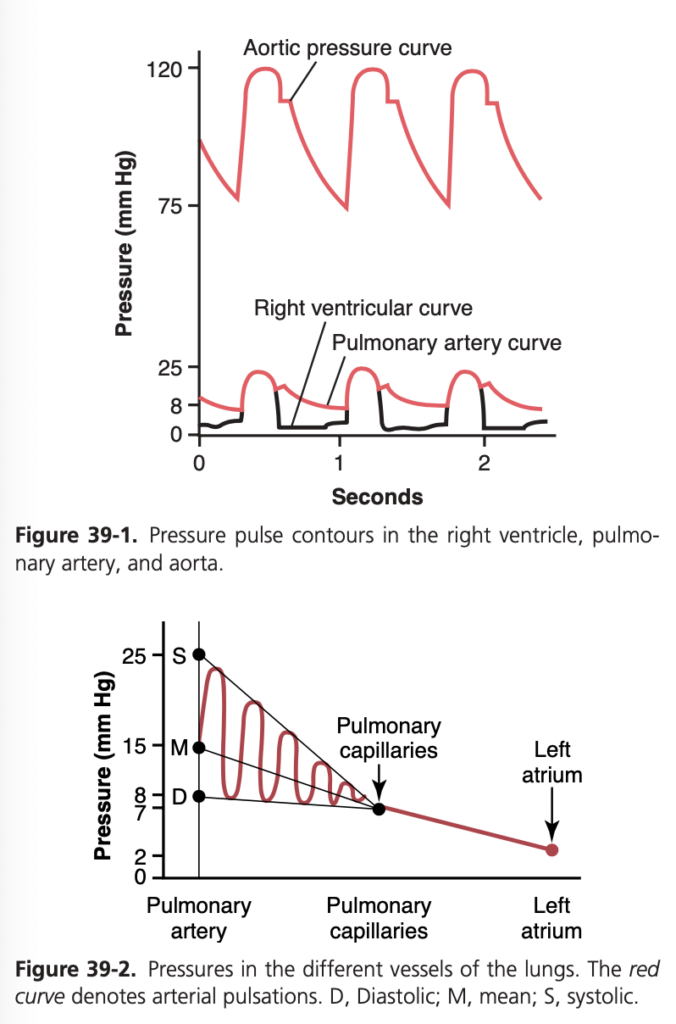
BLOOD VOLUME OF THE LUNGS
The blood volume of the lungs is about 450 ml, about 9% of the total blood volume of the entire circulatory system. Approximately 70 ml of this pulmonary blood volume is in the pulmonary capillaries; the remainder is divided about equally between the pulmonary arteries and veins.
Lungs Serve as a Blood Reservoir. Under various physi- ological and pathological conditions, the quantity of blood in the lungs can vary from as little as half-normal up to twice normal. For example, when a person blows out air so hard that high pressure is built up in the lungs, such as when blowing a trumpet, as much as 250 ml of blood can be expelled from the pulmonary circulatory system into the systemic circulation. Also, loss of blood from the sys- temic circulation by hemorrhage can be partly compen- sated for by the automatic shift of blood from the lungs into the systemic vessels.
Cardiac Pathology May Shift Blood From Systemic Circulation to Pulmonary Circulation. Failure of the left side of the heart, or increased resistance to blood flow through the mitral valve as a result of mitral stenosis or mitral regurgitation, causes blood to dam up in the pul- monary circulation, sometimes increasing the pulmonary blood volume as much as 100% and causing large increas- es in the pulmonary vascular pressures. Because the vol- ume of the systemic circulation is about nine times that of the pulmonary system, a shift of blood from one system to the other affects the pulmonary system greatly but usually has only mild systemic circulatory effects.
BLOOD FLOW THROUGH THE LUNGS AND ITS DISTRIBUTION
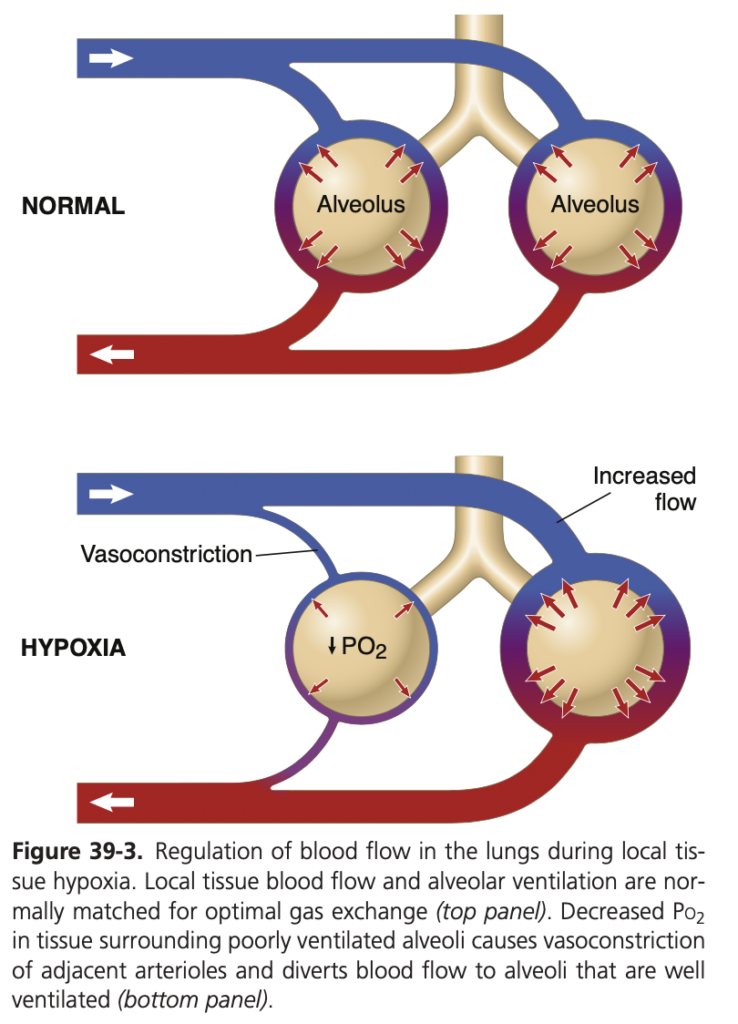
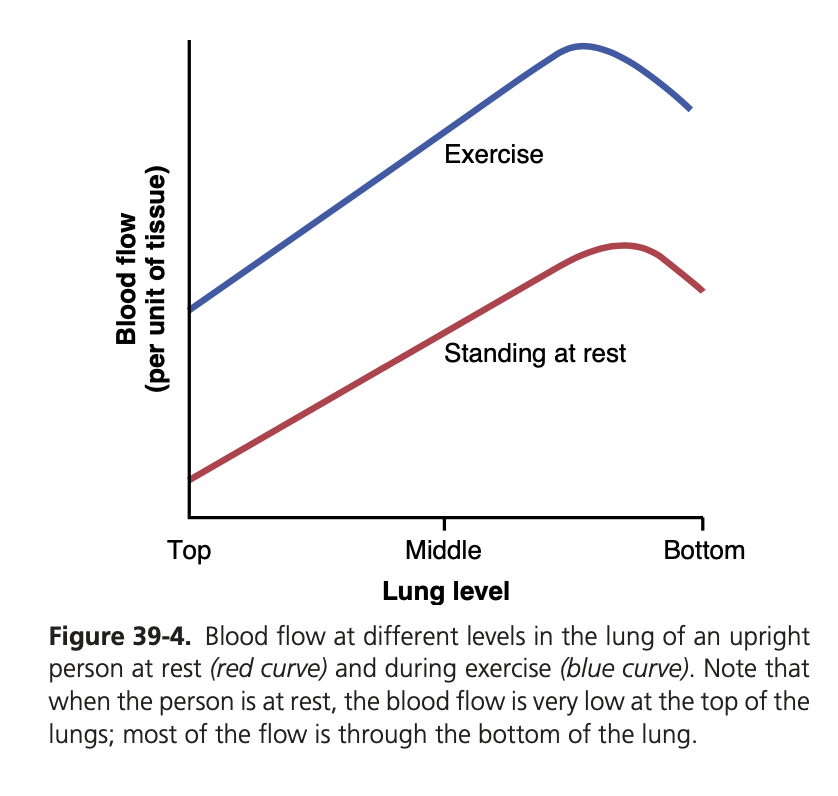
Blood flow through the lungs is essentially equal to the cardiac output. Therefore, the factors that control car- diac output—mainly peripheral factors, as discussed in Chapter 20—also control pulmonary blood flow. Under most conditions, the pulmonary vessels act as distensible tubes that enlarge with increasing pressure and narrow with decreasing pressure. For adequate aeration of the blood to occur, the blood must be distributed to the seg- ments of the lungs where the alveoli are best oxygenated. This distribution is achieved by the following mechanism.
Decreased Alveolar Oxygen Reduces Local Alveolar Blood Flow and Regulates Pulmonary Blood Flow Distribution. When the concentration of O2 in the air of the alveoli decreases below normal, especially when it falls below 70% of normal (i.e., <73 mm Hg Po2), the ad- jacent blood vessels constrict (Figure 39-3) and may in- crease vascular resistance more than fivefold at extremely low O2 levels. This effect is opposite to the effect observed in systemic vessels, which dilate rather than constrict in response to low O2 levels. Although the mechanisms that promote pulmonary vasoconstriction during hypoxia are not completely understood, low O2 concentration may have the following effects: (1) stimulate release of, or in- crease sensitivity to, vasoconstrictor substances such as endothelin or reactive oxygen species; or (2) decrease re- lease of a vasodilator, such as nitric oxide, from the lung tissue.
Some studies have suggested that hypoxia may directly induce vasoconstriction by inhibition of oxygen-sensitive potassium ion channels in pulmonary vascular smooth muscle cell membranes. With low partial pressures of oxy- gen, these channels are blocked, leading to depolarization of the cell membrane and activation of calcium channels and causing the influx of calcium ions. The rise of calcium concentration then causes constriction of small arteries and arterioles.
The increase in pulmonary vascular resistance as a result of low O2 concentration has the important function of distributing blood flow where it is most effective. That is, if some alveoli are poorly ventilated and have a low O2 concentration, the local vessels constrict. This constric- tion causes the blood to flow through other areas of the lungs that are better aerated, thus providing an automatic control system for distributing blood flow to the pulmo- nary areas in proportion to their alveolar O2 pressures.
EFFECT OF HYDROSTATIC PRESSURE GRADIENTS IN THE LUNGS ON REGIONAL PULMONARY BLOOD FLOW
In Chapter 15, we pointed out that the blood pressure in the foot of a standing person can be as much as 90 mm Hg greater than the pressure at the level of the heart. This dif- ference is caused by hydrostatic pressure—that is, by the weight of the blood itself in the blood vessels. The same effect, but to a lesser degree, occurs in the lungs. In the upright adult, the lowest point in the lungs is normally about 30 cm below the highest point, which represents a 23-mm Hg pressure difference, about 15 mm Hg of which is above the heart and 8 below. That is, the pulmonary arterial pressure in the uppermost portion of the lung of a standing person is about 15 mm Hg less than the pul- monary arterial pressure at the level of the heart, and the pressure in the lowest portion of the lungs is about 8 mm Hg higher.
Such pressure differences have profound effects on blood flow through the different areas of the lungs. This effect is demonstrated by the lower curve in Figure 39-4, which depicts blood flow per unit of lung tissue at differ- ent levels of the lung in the upright person. Note that in he standing position at rest, there is little flow in the top of the lung but about five times as much flow in the bot- tom. To help explain these differences, the lung is often described as being divided into three zones, as shown in Figure 39-5. In each zone, the patterns of blood flow are quite different.
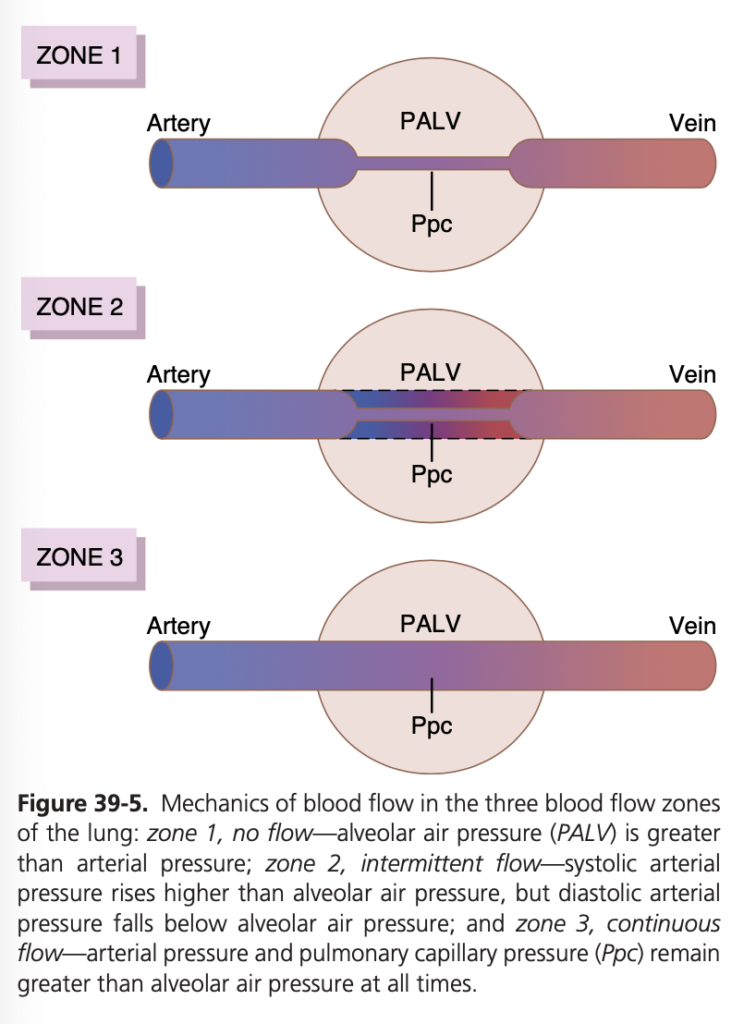
Zones 1, 2, and 3 of Pulmonary Blood Flow
The capillaries in the alveolar walls are distended by the blood pressure inside them but simultaneously are compressed by the alveolar air pressure on their out- sides. Therefore, whenever the lung alveolar air pressure becomes greater than the capillary blood pressure, the capillaries close, and there is no blood flow. Under dif- ferent normal and pathological lung conditions, one may find any one of three possible zones (patterns) of pulmo- nary blood flow, as follows:
• Zone 1: No blood flow during all portions of the car- diac cycle because the local alveolar capillary pressure in that area of the lung never rises higher than the al- veolar air pressure during any part of the cardiac cycle
• Zone 2: Intermittent blood flow only during the peaks of pulmonary arterial pressure because the systolic pressure is then greater than the alveolar air pressure, but the diastolic pressure is less than the alveolar air pressure
• Zone 3: Continuous blood flow because the alveolar capillary pressure remains greater than alveolar air pressure during the entire cardiac cycle
Normally, the lungs have only zones 2 and 3 blood flow—zone 2 (intermittent flow) in the apices and zone 3 (continuous flow) in all the lower areas. For example, when a person is in the upright position, the pulmonary arterial pressure at the lung apex is about 15 mm Hg less than the pressure at the level of the heart. Therefore, the apical systolic pressure is only 10 mm Hg (25 mm Hg at heart level minus 15 mm Hg hydrostatic pressure differ- ence). This 10 mm Hg apical blood pressure is greater than the 0 alveolar air pressure, so blood flows through the pulmonary apical capillaries during cardiac systole. Conversely, during diastole, the 8 mm Hg diastolic pres- sure at the level of the heart is not sufficient to push the blood up the 15 mm Hg hydrostatic pressure gradi- ent required to cause diastolic capillary flow. Therefore, blood flow through the apical part of the lung is inter- mittent, with flow during systole but cessation of flow during diastole; this is called zone 2 blood flow. Zone 2 blood flow begins in normal lungs about 10 cm above the midlevel of the heart and extends from there to the top of the lungs.
In the lower regions of the lungs, from about 10 cm above the level of the heart all the way to the bottom of the lungs, the pulmonary arterial pressure during both systole and diastole remains greater than the 0 alveolar air pressure. Therefore, continuous flow occurs through the alveolar capillaries, or zone 3 blood flow. Also, when a person is lying down, no part of the lung is more than a few centimeters above the level of the heart. In this case, blood flow in a normal person is entirely zone 3 blood flow, including the lung apices.
Zone 1 Blood Flow Occurs Only Under Abnormal Conditions. Zone 1 blood flow, which means no blood flow at any time during the cardiac cycle, occurs when the pulmonary systolic arterial pressure is too low or the alveolar pressure is too high to allow flow. For ex- ample, if an upright person is breathing against a posi- tive air pressure so that the intra-alveolar air pressure is at least 10 mm Hg greater than normal but the pul- monary systolic blood pressure is normal, one would expect zone 1 blood flow—no blood flow—in the lung apices. Another case in which zone 1 blood flow oc- curs is in an upright person whose pulmonary systolic arterial pressure is exceedingly low, as might occur after severe blood loss.
Exercise Increases Blood Flow Through All Parts of the Lungs. Referring again to Figure 39-4, one sees that the blood flow in all parts of the lung increases during ex- ercise. A major reason for increased blood flow is that the pulmonary vascular pressures rise enough during exercise to convert the lung apices from a zone 2 pattern into a zone 3 pattern of flow.
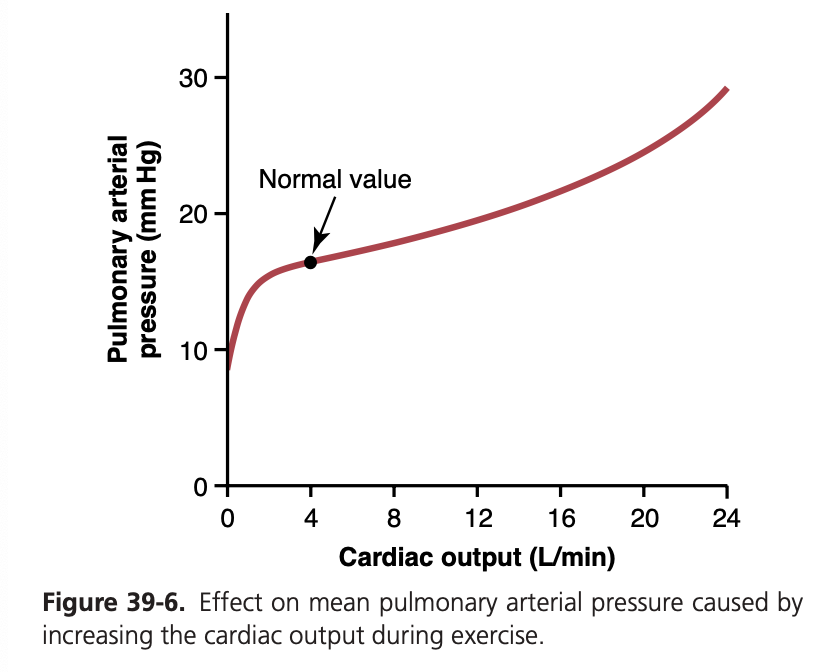
Increased Cardiac Output During Heavy Exercise Is Normally Accommodated by the Pulmonary Circulation Without Large Increases in Pulmonary Artery Pressure
During heavy exercise, blood flow through the lungs may increase fourfold to sevenfold. This extra flow is accom- modated in the lungs in three ways: (1) by increasing the number of open capillaries, sometimes as much as three- fold; (2) by distending all the capillaries and increasing the rate of flow through each capillary more than two- fold; and (3) by increasing the pulmonary arterial pres- sure. Normally, the first two changes decrease pulmonary vascular resistance so much that the pulmonary arterial pressure rises very little, even during maximum exercise. This effect is shown in Figure 39-6.
The ability of the lungs to accommodate greatly increased blood flow during exercise, without increas- ing the pulmonary arterial pressure, conserves the energy of the right side of the heart. This ability also prevents a major rise in pulmonary capillary pressure and the devel- opment of pulmonary edema.
Function of Pulmonary Circulation When Left Atrial Pressure Rises as a Result of Left-Sided Heart Failure
The left atrial pressure in a healthy person almost never rises above +6 mm Hg, even during the most strenuous exercise. These small changes in left atrial pressure have virtually no effect on pulmonary circulatory function because this merely expands the pulmonary venules and opens up more capillaries so that blood continues to flow with almost equal ease from the pulmonary arteries.
When the left side of the heart fails, however, blood begins to dam up in the left atrium. As a result, the left atrial pressure can rise on occasion from its normal value of 1 to 5 mm Hg to as high as 40 to 50 mm Hg. The ini- tial rise in atrial pressure, up to about 7 mm Hg, has lit- tle effect on pulmonary circulatory function. However, when the left atrial pressure rises to greater than 7 or 8 mm Hg, further increases in left atrial pressure cause almost equally great increases in pulmonary arterial pres- sure, thus causing a concomitant increased load on the right heart. Any increase in left atrial pressure above 7 or 8 mm Hg increases capillary pressure almost equally as much. When the left atrial pressure rises above 30 mm Hg, causing similar increases in capillary pressure, pul- monary edema is likely to develop, as discussed later in the chapter.
PULMONARY CAPILLARY DYNAMICS
Exchange of gases between the alveolar air and pulmo- nary capillary blood is discussed in the next chapter. How- ever, it is important to note here that the alveolar walls are lined with so many capillaries that in most places, the capillaries almost touch one another side by side. There- fore, it is often said that the capillary blood flows in the alveolar walls as a “sheet of flow,” rather than in individual capillaries.
Pulmonary Capillary Pressure. Although direct meas- urements of pulmonary capillary pressure have not been reported, indirect estimates have suggested that it nor- mally averages about 7 mm Hg. This value is probably nearly correct because the mean left atrial pressure is about 2 mm Hg, and the mean pulmonary arterial pres- sure is only 15 mm Hg, so the mean pulmonary capillary pressure must lie somewhere between these two values.
Length of Time Blood Stays in the Pulmonary Cap- illaries. From histological studies of the total cross- sectional area of all the pulmonary capillaries, it can be calculated that when the cardiac output is normal, blood passes through the pulmonary capillaries in about 0.8 second. When the cardiac output increases, this time can shorten to as little as 0.3 second. The shortened time would be much greater were it not for the fact that addi- tional capillaries, which normally are collapsed, open up to accommodate the increased blood flow. Thus, in only a fraction of a second, blood passing through the alveolar capillaries becomes oxygenated and loses its excess car- bon dioxide.
Capillary Exchange of Fluid in the Lungs and Pulmonary Interstitial Fluid Dynamics
The dynamics of fluid exchange across the lung capillary membranes are qualitatively the same as for peripheral tissues. However, quantitatively, there are important dif- ferences, as follows:
1. The pulmonary capillary pressure is low, about 7 mm Hg, in comparison with a considerably higher functional capillary pressure in many peripheral tis- sues of about 17 mm Hg.
2. The interstitial fluid pressure in the lung is slightly more negative than that in peripheral subcutane-ous tissue. (This pressure has been measured in two ways—by a micropipette inserted into the pulmonary interstitium, giving a value of about −5 mm Hg, and by measuring the absorption pressure of fluid from the alveoli, giving a value of about −8 mm Hg.)
- The colloid osmotic pressure of the pulmonary inter- stitial fluid is about 14 mm Hg, in comparison with less than half this value in most peripheral tissues.
- The alveolar walls are extremely thin, and the alveo- lar epithelium covering the alveolar surfaces is so weak that it can be ruptured by any positive pres- sure in the interstitial spaces greater than alveolar air pressure (>0 mm Hg), which allows dumping of fluid from the interstitial spaces into the alveoli. Now let us see how these quantitative differences affect pulmonary fluid dynamics.
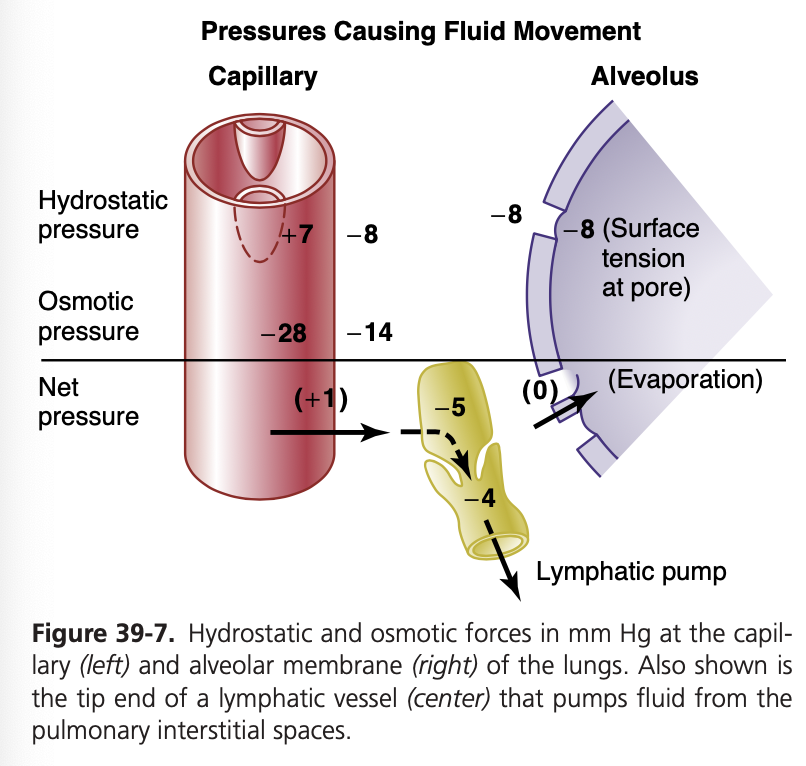
Interrelationships Between Interstitial Fluid Pressure and Other Pressures in the Lung. Figure 39-7 shows a pulmonary capillary, pulmonary alveolus, and lymphatic capillary draining the interstitial space between the blood capillary and alveolus. Note the balance of forces at the blood capillary membrane, as follows:
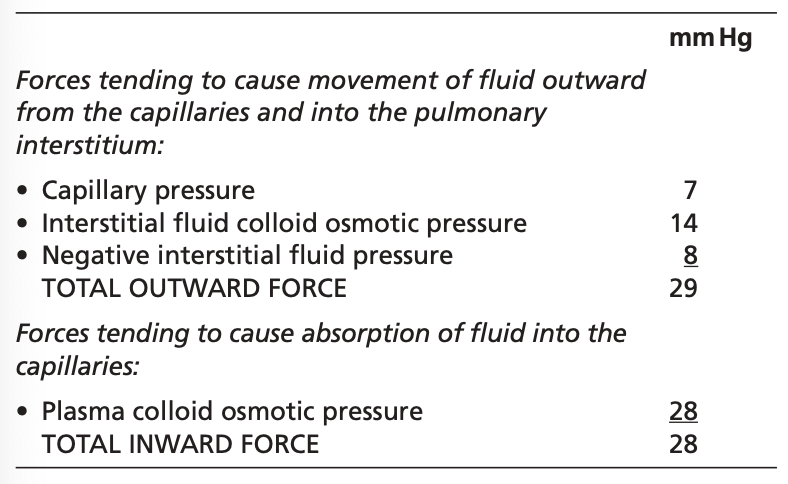
Thus, the normal outward forces are slightly greater than the inward forces, providing a mean filtration pres- sure at the pulmonary capillary membrane that can be calculated as +29 − 28 mm Hg = +1 mm Hg.
This filtration pressure causes a slight continual flow of fluid from the pulmonary capillaries into the interstitial spaces and, except for a small amount that evaporates in the alveoli, this fluid is pumped back to the circulation through the pulmonary lymphatic system.
Negative Pulmonary Interstitial Pressure and Mecha- nism for Keeping Alveoli Dry. What keeps the alveoli from filling with fluid under normal conditions? The pulmo- nary capillaries and pulmonary lymphatic system normally maintain a slight negative pressure in the interstitial spaces; whenever extra fluid appears in the alveoli, it is sucked me- chanically into the lung interstitium through the small open- ings between the alveolar epithelial cells. The excess fluid is then carried away through the pulmonary lymphatics. Thus, under normal conditions, the alveoli are kept “dry,” except for a small amount of fluid that seeps from the epithelium onto the lining surfaces of the alveoli to keep them moist.
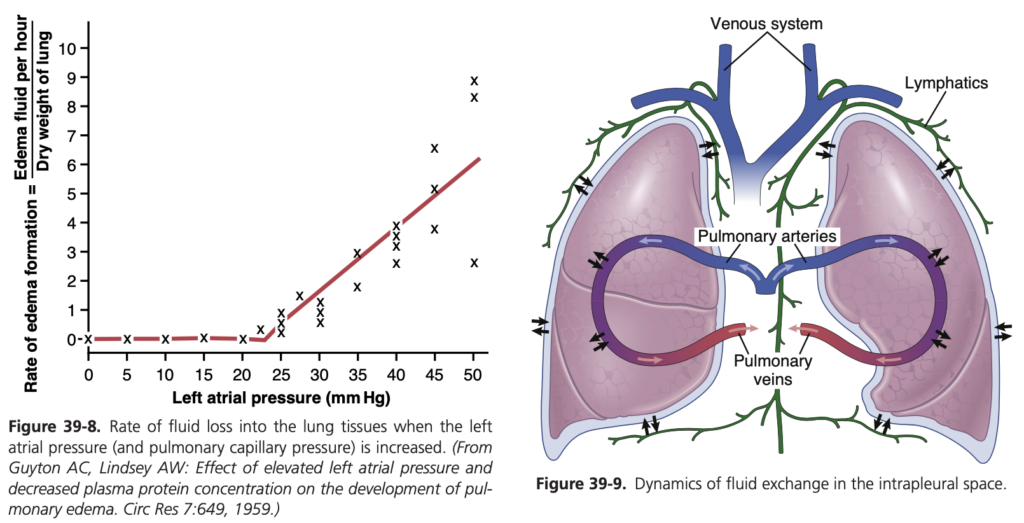
Pulmonary Edema
Pulmonary edema occurs in the same way that edema occurs elsewhere in the body. Any factor that increases fluid filtration out of the pulmonary capillaries or that impedes pulmonary lymphatic function and causes the pulmonary interstitial fluid pressure to rise from the negative range into the positive range will tend to cause filling of the pulmonary interstitial spaces and alveoli with free fluid.
The most common causes of pulmonary edema are as follows:
1. Left-sided heart failure or mitral valve disease, with consequent great increases in pulmonary venous pres- sure and pulmonary capillary pressure and flooding of the interstitial spaces and alveoli
2. Damage to the pulmonary blood capillary membranes caused by infections such as pneumonia or by breathing noxious substances such as chlorine gas or sulfur diox- ide gas
Each of these mechanisms causes rapid leakage of plas- ma proteins and fluid out of the capillaries and into the lung interstitial spaces and alveoli.
Pulmonary Edema Safety Factor. Experiments in ani- mals have shown that the pulmonary capillary pressure normally must rise to a value at least equal to the colloid osmotic pressure of the plasma inside the capillaries before significant pulmonary edema will occur. To give an example, Figure 39-8 shows how different levels of left atrial pressure increase the rate of pulmonary edema formation in dogs. Remember that every time the left atrial pressure rises to high values, the pulmonary capillary pressure rises to a level 1 to 2 mm Hg greater than the left atrial pressure. In these experiments, as soon as the left atrial pressure rose above 23 mm Hg (causing the pulmonary capillary pressure to rise above 25 mm Hg), fluid began to accumulate in the lungs. This fluid accumulation increased even more rapidly with
further increases in capillary pressure. The plasma colloid osmotic pressure during these experiments was equal to this 25 mm Hg critical pressure level. Therefore, in a person, whose normal plasma colloid osmotic pressure is 28 mm Hg, one can predict that the pulmonary capillary pressure must rise from the normal level of 7 mm Hg to more than 28 mm Hg to cause substantial pulmonary edema, giving an acute safety factor against pulmonary edema of 21 mm Hg. Safety Factor in Chronic Conditions. When the pulmo- nary capillary pressure remains elevated chronically (for at least 2 weeks), the lungs become even more resistant to pulmonary edema because the lymph vessels expand great- ly, increasing their capability of carrying fluid away from the interstitial spaces perhaps as much as 10-fold. There- fore, in patients with chronic mitral stenosis, pulmonary capillary pressures of 40 to 45 mm Hg have been measured without the development of lethal pulmonary edema. Rapidity of Death in Persons With Acute Pulmonary Edema. When the pulmonary capillary pressure rises even slightly above the safety factor level, lethal pulmonary ede- ma can occur within hours, or even within 20 to 30 minutes if the capillary pressure rises 25 to 30 mm Hg above the safety factor level. Thus, in acute left-sided heart failure, in which the pulmonary capillary pressure occasionally does rise to 50 mm Hg, death may ensue in less than 30 minutes as a result of acute pulmonary edema.
FLUID IN THE PLEURAL CAVITY
When the lungs expand and contract during normal breathing, they slide back and forth within the pleural cavity. To facilitate this movement, a thin layer of mucoid fluid lies between the parietal and visceral pleurae. Figure 39-9 shows the dynamics of fluid exchange in the pleural space. The pleural membrane is a porous, mesenchymal, serous membrane through which small amounts of interstitial fluid transude continually into the pleural space. These fluids carry tissue proteins with them, giving the pleural fluid a mucoid characteristic, which is what allows extremely easy slippage of the moving lungs. The total amount of fluid in each pleural cavity is nor- mally slight—only a few milliliters. Whenever the quan- tity becomes more than barely enough to begin flowing in the pleural cavity, the excess fluid is pumped away by lymphatic vessels opening directly from the pleural cav- ity into the following: (1) the mediastinum; (2) the supe- rior surface of the diaphragm; and (3) the lateral surfaces of the parietal pleura. Therefore, the pleural space—the space between the parietal and visceral pleurae—is called a potential space because it normally is so narrow that it is not obviously a physical space.
Negative Pressure in Pleural Fluid. A negative force is always required on the outside of the lungs to keep the lungs expanded. This force is provided by negative pres- sure in the normal pleural space. The basic cause of this negative pressure is pumping of fluid from the space by the lymphatics, which is also the basis of the nega- tive pressure found in most tissue spaces of the body. Because the normal collapse tendency of the lungs is about −4 mm Hg, the pleural fluid pressure must al- ways be at least as negative as −4 mm Hg to keep the lungs expanded. Actual measurements have shown that the pressure is usually about –7 mm Hg, which is a few millimeters of mercury more negative than the collapse pressure of the lungs. Thus, the negativity of the pleural fluid pressure keeps the normal lungs pulled against the parietal pleura of the chest cavity, except for an extremely thin layer of mucoid fluid that acts as a lubricant.
Pleural Effusion—Collection of Large Amounts of Free Fluid in the Pleural Space. Pleural effusion is analogous to edema fluid in the tissues and can be called edema of the pleural cavity. The causes of the effusion are the same as the causes of edema in other tissues (discussed in Chap- ter 25), including the following: (1) blockage of lymphatic drainage from the pleural cavity; (2) cardiac failure, which causes excessively high peripheral and pulmonary capil- lary pressures, leading to excessive transudation of fluid into the pleural cavity; (3) greatly reduced plasma colloid osmotic pressure, thus allowing excessive transudation of fluid; and (4) infection or any other cause of inflamma- tion of the surfaces of the pleural cavity, which increases permeability of the capillary membranes and allows rapid dumping of plasma proteins and fluid into the cavity.

コメント